Chainlink Hovers Above $11 As Bears Resume Their Decline
Estimated Reading Time: 2 minutes
Don’t invest unless you’re prepared to lose all the money you invest. This is a high-risk investment and you are unlikely to be protected if something goes wrong. Take 2 minutes to learn more

Chainlink (LINK) Long-Term Analysis: Bearish
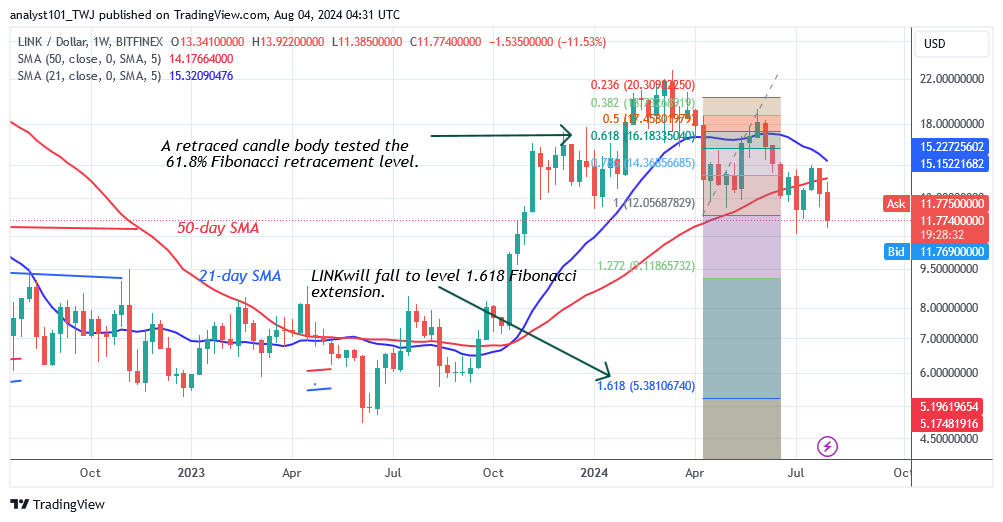
Chainlink’s (LINK) price falls below the moving average lines as bears resume their decline. Further upward movement of the cryptocurrency above the moving average lines is unlikely, as the coin’s price was repelled following a retest. The downward trend has begun, with the altcoin reaching a low of $11.69. On the downside, the cryptocurrency’s price is projected to retest its prior low of July 5. Chainklink’s pricing is expected to fall further.
On April 8, the price dropped, and a retraced candle body tested the 61.8% Fibonacci retracement line on May 27. The correction predicts that LINK will fall to the 1.618 Fibonacci extension, or $5.38. The altcoin currently has a value of $11.76.
Technical indicators:
Major Resistance Levels – $20.00, $22.00, $24.00
Major Support Levels – $12.00, $10.00, $8.00
Chainlink (LINK) Indicator Analysis
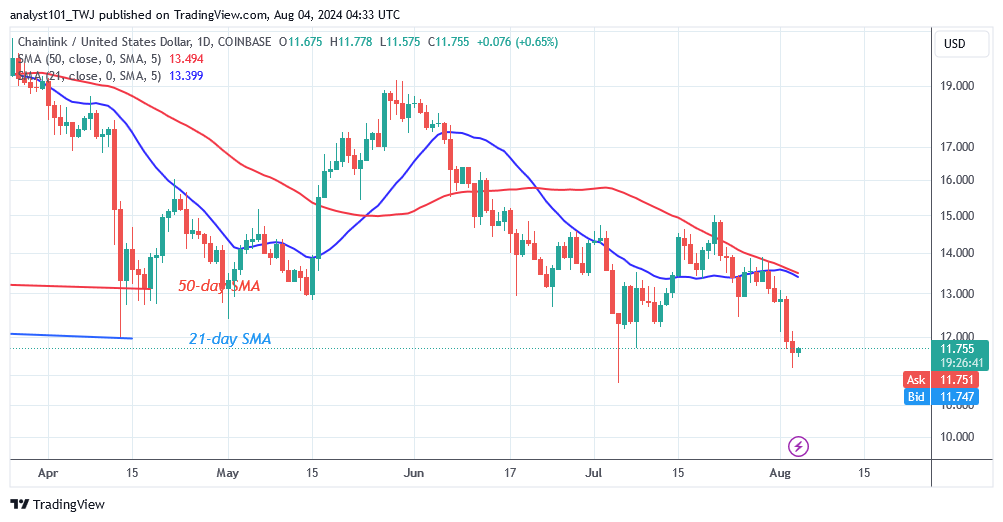
The selling pressure has begun as price bars return to the bearish trend zone. On July 5, a long candlestick pointed to $11.04 support. The extended candlestick tail implies significant buying pressure at the current support level. However, if the bears break through the current support, Chainlink will reach the expected price of $5.38.
What Is the Next Direction for Chainlink (LINK)?
Chainlink’s price has remained above the $11 support for the past 48 hours as bears resume their decline. For the past month, the altcoin has traded between $11 and below the moving average lines. The bears are threatening to increase selling pressure above the present support. Meanwhile, the crypto signal is range-bound, with the altcoin fluctuating above its present support.
You can purchase Lucky Block here. Buy LBLOCK
Note: Cryptosignals.org is not a financial advisor. Do your research before investing your funds in any financial asset or presented product or event. We are not responsible for your investing result.