Chainlink Is in the Oversold Region as It Hovers Above $5.77 Support
Estimated Reading Time: 2 minutes
Don’t invest unless you’re prepared to lose all the money you invest. This is a high-risk investment and you are unlikely to be protected if something goes wrong. Take 2 minutes to learn more
Chainlink (LINK) Long-Term Analysis: Bearish
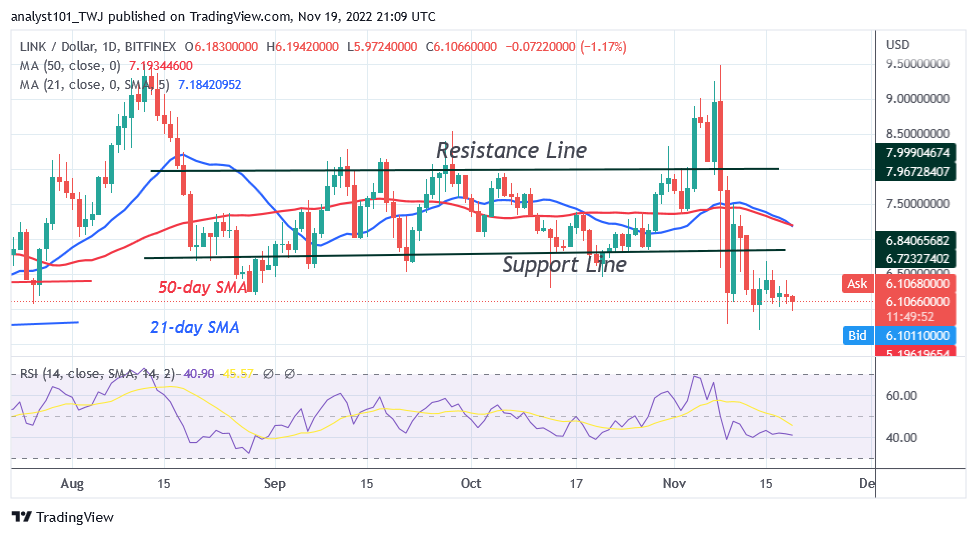
Chainlink (LINK) price is in a downtrend as it hovers above $5.77 support. For the past week, the crypto has been trading above the $5.77 support. On November 15, the crypto’s upward move was halted at the $6.68 peak. On the downside, sellers will attempt to retest the previous low of $5.31. Since June 13, buyers have persistently maintained the $5.31 level as support. But if the support level of $5.31 is breached, Chainlink would drop to a low of $3.75. On the other hand, if the existing support continues to hold, the LINK price will recover and begin to rise.
Chainlink (LINK) Indicator Analysis
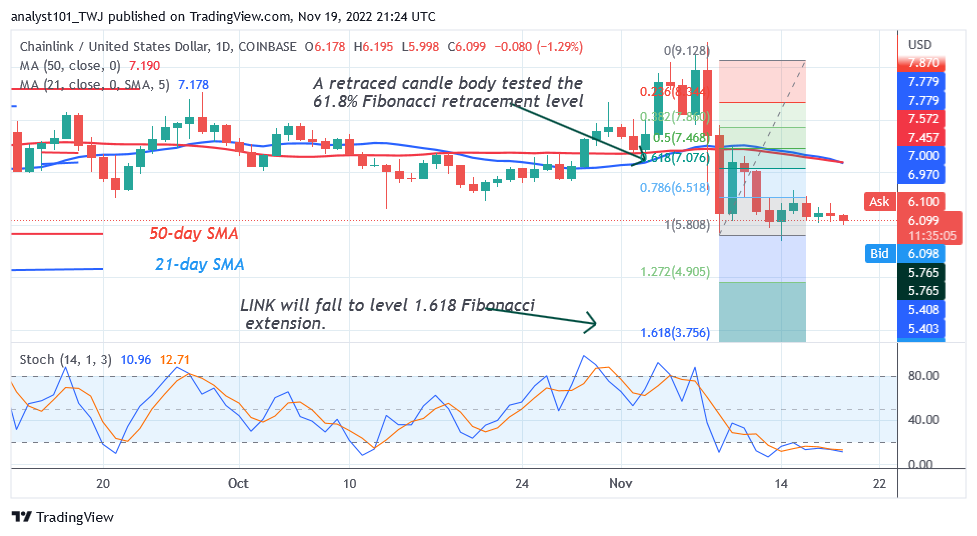
Chainlink’s Relative Strength Index level for period 14 is 40. LINK continues to move in a bearish trend zone and may decline. Since the price bars for LINK are lower than the moving average lines, a further drop is indicated. The cryptocurrency is trading below level 20, which indicates an oversold market, on the daily Stochastic.
Technical indicators:
Major Resistance Levels – $18.00, $20.00, $22.00
Major Support Levels – $8.00, $6.00, $4.00
What Is the Next Direction for Chainlink (LINK)?
Chainlink is deviating farther to the downside as it hovers above $5.77 support. The LINK price reversed upward during the decline on November 9 and a candle body tested the 61.8% Fibonacci retracement level. According to the correction, the price of LINK will drop to the level of the 1.618 Fibonacci extension, or $3.75.
You can purchase crypto coins here. Buy LBLOCK
Note: Cryptosignals.org is not a financial advisor. Do your research before investing your funds in any financial asset or presented product or event. We are not responsible for your investing results