Chainlink Is Unable to Sustain above $8 as It Resumes Range Bound Move
Estimated Reading Time: 2 minutes
Don’t invest unless you’re prepared to lose all the money you invest. This is a high-risk investment and you are unlikely to be protected if something goes wrong. Take 2 minutes to learn more


Free Crypto Signals Channel
Chainlink (LINK) Long-Term Analysis: Bearish
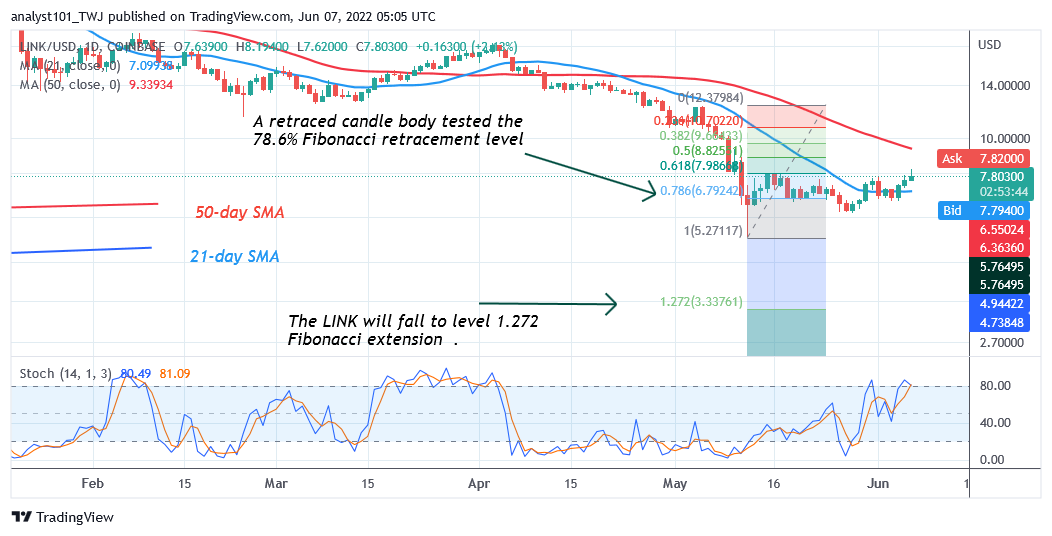
Chainlink (LINK) is in a downward correction as it resumes range bound move. The bulls have broken above the 21-day line SMA twice but could break the resistance at $8. Presently, the crypto is fluctuating between $6.20 and $8 price levels. On the upside, if the bulls break the resistance at $8, the market will rally to $12. In other words, the altcoin will rally to the 50-day line SMA. Nevertheless, LINK/USD will continue its range-bound move if it faces rejection at the recent high. On the downside, if the crypto slumps and breaks below the $6.20 support, it will signal the resumption of downtrend. The market will decline to the previous low at $5.50.
Chainlink (LINK) Indicator Analysis
Chainlink is at level 50 of the Relative Strength Index for period 14. It indicates that there is a balance between supply and demand. The crypto’s price is above the 21-day line SMA but below the 50-day line SMA indicating a possible range bound move. The altcoin is above the 80% area of the daily stochastic. The altcoin has reached the overbought region.
Technical indicators:
Major Resistance Levels – $20.00, $22.00, $24.00
Major Support Levels – $12.00, $10.00, $8.00
What Is the Next Direction for Chainlink (LINK)?
Chainlink may resume selling pressure as it resumes range bound move. Meanwhile, on May 12 downtrend; a retraced candle body tested the 78.6% Fibonacci retracement level. The retracement indicates that LINK will fall to level 1.272 Fibonacci extension or $3.03.
You can purchase crypto coins here. Buy LBlock
Note: Cryptosignals.org is not a financial advisor. Do your research before investing your funds in any financial asset or presented product or event. We are not responsible for your investing results