Chainlink (LINK) Retraces After Rejection From Level $51.02
Estimated Reading Time: 2 minutes
Don’t invest unless you’re prepared to lose all the money you invest. This is a high-risk investment and you are unlikely to be protected if something goes wrong. Take 2 minutes to learn more
Chainlink (LINK) Long-Term Analysis: Bullish
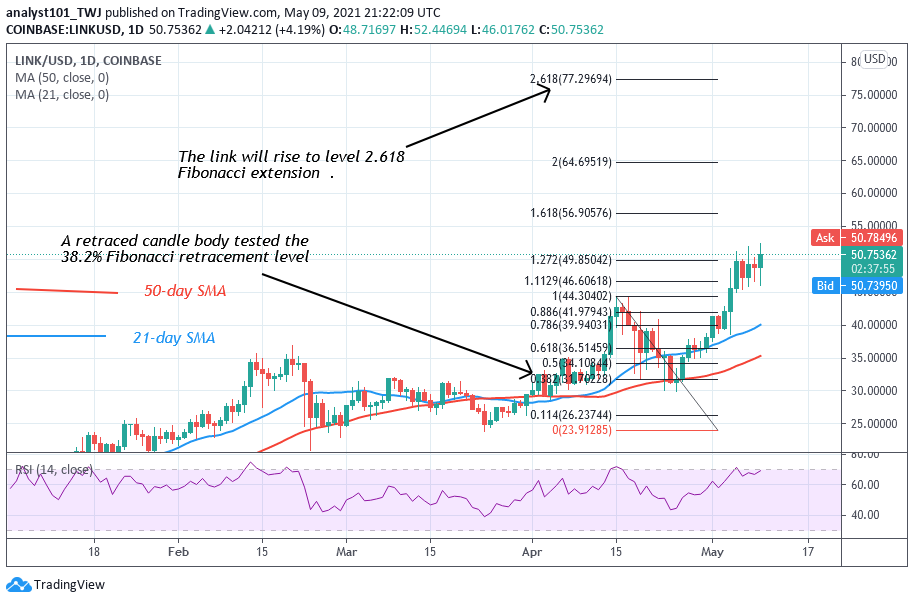
Since May 5, LINK has been fluctuating below the $51.20 resistance. The LINK price is falling after retesting the $51.20 resistance. In previous price action, Chainlink fluctuates between levels $46 and $52, each the altcoin retests the current high. On April 15 uptrend; a retraced candle body tested the 38.2% Fibonacci retracement level. The retracement indicates that the link will rise to level 2.618 Fibonacci extension
or the high of $77.29.
Chainlink (LINK) Indicator Analysis
The altcoin has reached level 66 of the Relative Strength Index period 14. LINK price is in the bullish trend zone and capable of rising on the upside. The 21-day SMA and 50-day SMA are sloping upward indicating the uptrend.
Technical indicators:
Major Resistance Levels – $60, $62, $64
Major Support Levels – $30, $28, $26
What Is the Next Direction for Chainlink (LINK)?
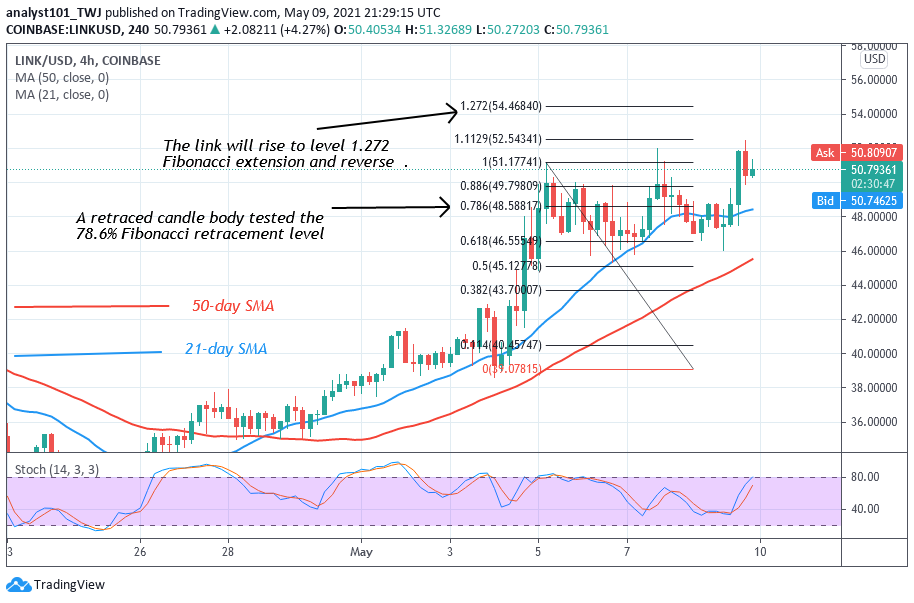
On the 4 –hour chart, Chainlink is in an upward move. The bulls have broken the previous price level to resume upward. On May 5 uptrend; a retraced candle body tested the 78.6% Fibonacci retracement level. This 2retracement implies that the market will rise to level 1.272Fibonacci extensions or the high of $54.47. The market is likely to reverse at the recent high
Note: cryptosignals.org is not a financial advisor. Do your research before investing your funds in any financial asset or presented product or event. We are not responsible for your investing results