Chainlink (LINK/USD) Trades in Well-Defined Range Levels
Estimated Reading Time: 3 minutes
Don’t invest unless you’re prepared to lose all the money you invest. This is a high-risk investment and you are unlikely to be protected if something goes wrong. Take 2 minutes to learn more
Chainlink Price Prediction – April 5
After a long-maintained bullish trend in the valuation of LINK/USD market operations, the crypto-economy has now entered well-defined range-bound trading zones characterized by visible falls and rises.
LINK/USD Market
Key Levels:
Resistance levels: $35, $40, $45
Support levels: $25, $20, $15
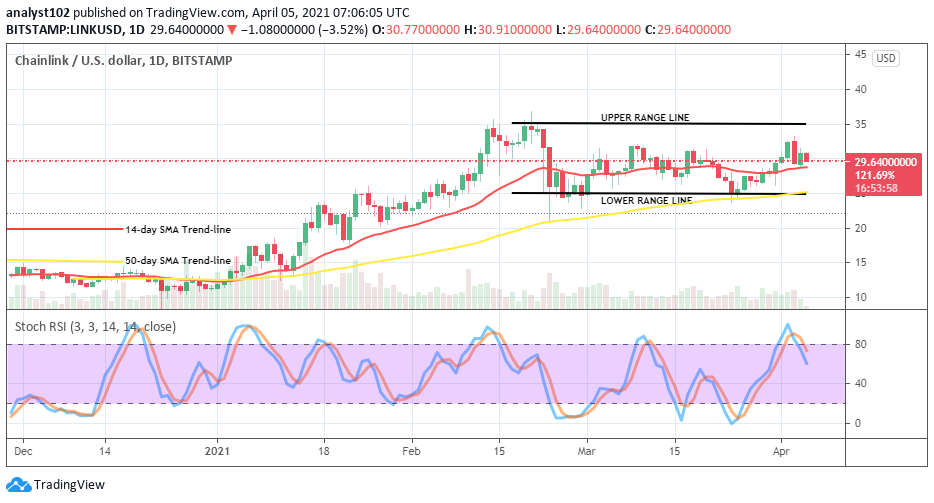
LINK/USD – Daily Chart
It is apparent on the LINK/USD daily trading chart that the market now moves in the mid-point of the $35 upper range line and the $25 lower range line. And, that gives a clear entry point for both the bull and the bear to trade in line with the range-bound trading principles. The 50-day SMA trend-line is situated around the lower range line below the 14-day SMA trading indicator that is located around the mid-point of both the range lines. The Stochastic Oscillators have briefly crossed from the overbought region to point to the south a bit below range 80. That shows a warning signal against seeing potential up at that point.
Will the LINK/USD price prolong trade in a range-bound pattern?
Going by the technical viewing of trading, presently, the LINK/USD market activities appear not to change in the near session. However, it would be ideally tactical to be on the lookout for either a breakout or a breakdown of the range lines as been referred to as either the $35 immediate resistance level or the upper range line and, the $35 immediate support level or the lower range line.
On the flip side, it would be more technically ideal that the LINK/USD bears patiently await price resisting line above the upper range line or rejection around it coming with active moves before considering joining the trading operations. A break down the lower range line may not be allowed to be on a long note of witnessing currently in this crypto-market. 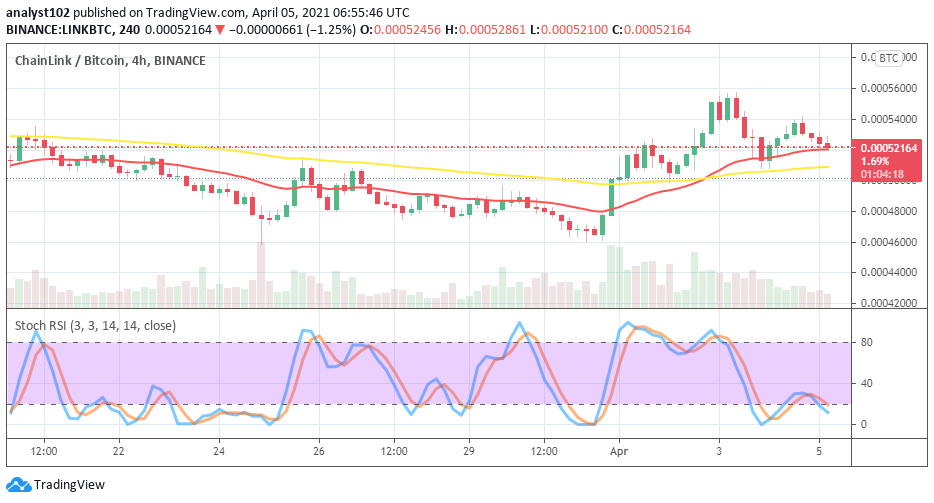
LINK/BTC Price Analysis
Taking a look at the market purchasing weight between LINK and BTC trading instruments, the counter-crypto has now begun to take to resist the base=crypto from a high point. Nevertheless, LINK still possesses a degree of appreciation as been compared with BTC as of writing. The two SMAs are located below the market trading level. But, the 14-day SMA trend-line has been touched from the top as the 50-day SMA is underneath it. The Stochastic Oscillators have moved downward to move about between range 40 and oversold region. That signifies that the current counter crypto’s energy may not sufficiently pullback against the base crypto in the near time.
Note: cryptosignals.org is not a financial advisor. Do your research before investing your funds in any financial asset or presented product or event. We are not responsible for your investing results