Chainlink (LINK/USDT) Eyes More Gains Amidst Growing Market Concern
Estimated Reading Time: 3 minutes
Don’t invest unless you’re prepared to lose all the money you invest. This is a high-risk investment and you are unlikely to be protected if something goes wrong. Take 2 minutes to learn more

Chainlink Long-term Analysis: Bullish
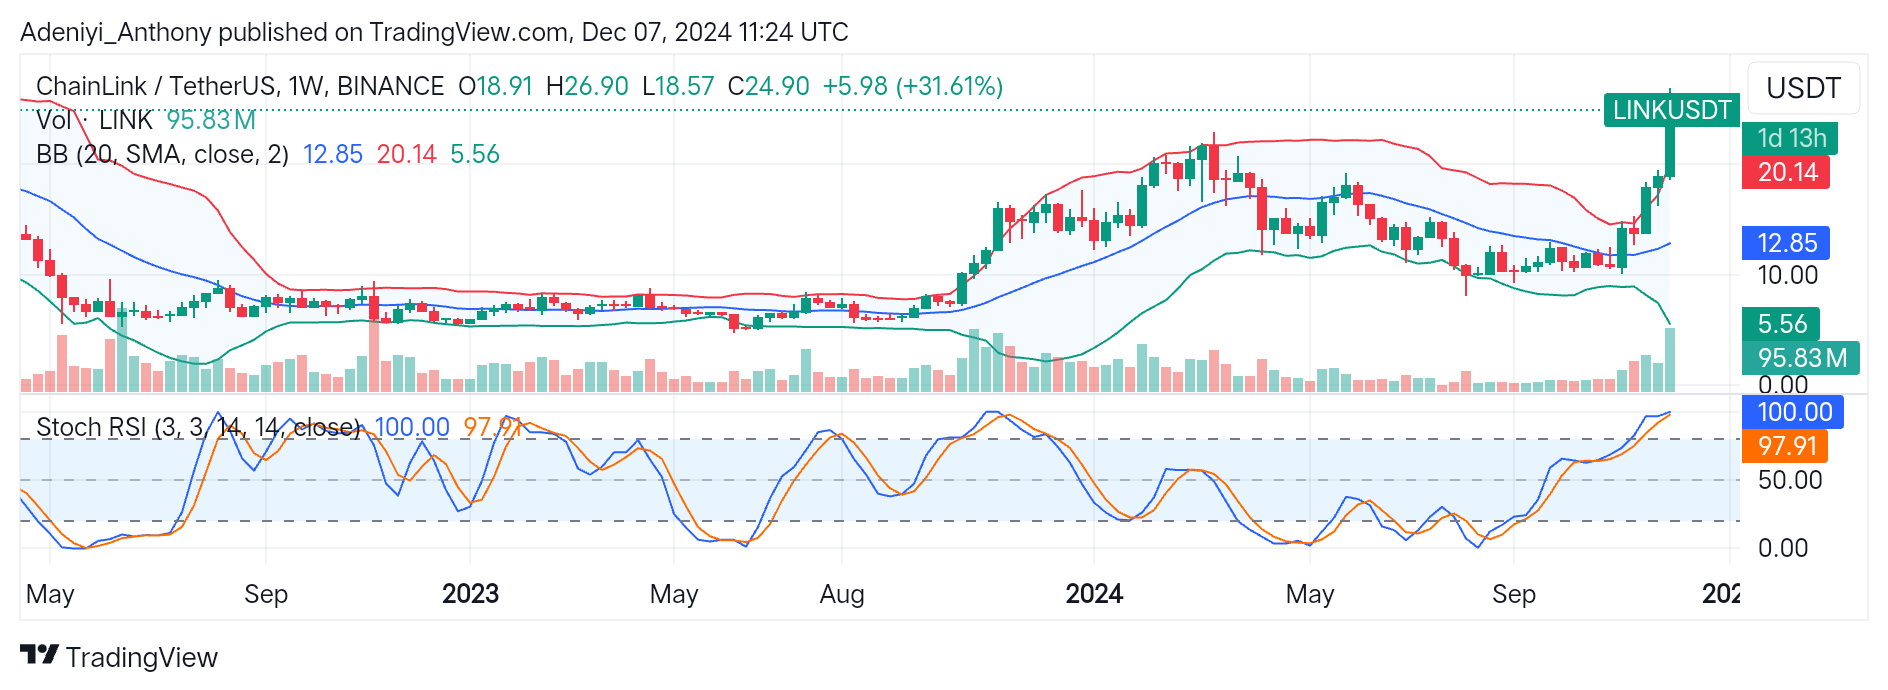
For weeks, Chainlink against the Tether has demonstrated remarkable bullish momentum by breaking out of its prolonged consolidation phase. This upside momentum has been supported by significant trading volume, which indicates strong market participation.
Recent price movement indicates the pair is operating above the upper Bollinger bands at $20.14, showing that LINK/USDT is determined to break above the $26.90 level. However, the indicator below’s overbought condition indicates a potential pullback might be on the horizon.
Currently, Chainlink trades at $24.90 with 95.83 million traded weekly volumes.
Technical Indicators
Major Resistance Levels: $26.90, $30.00, and $35.00
Major Support Levels: $20.14, $12.85, and $5.56
Chainlink Technical Analysis
The analysis of the Chainlink against the Tether on a weekly timeframe shows that the market has shifted decisively bullish, breaking above key resistance levels. The rally’s strength suggests a potential for continued gains as the pair operates above the Bollinger bands with increased trading volumes.
Therefore, a break above $26.90 could open the door for a move towards $30.00 and beyond.
On the other hand, the Stochastic RSI suggests a pullback before realizing further gains as the pair operates deep into the overbought region. To this end, if the price fails to hold at the current level, a pullback to $20.14 may be expected. However, a price dip below the immediate support may signal a retracement toward lower support zones.
LINK/USDT Analysis: Expectations
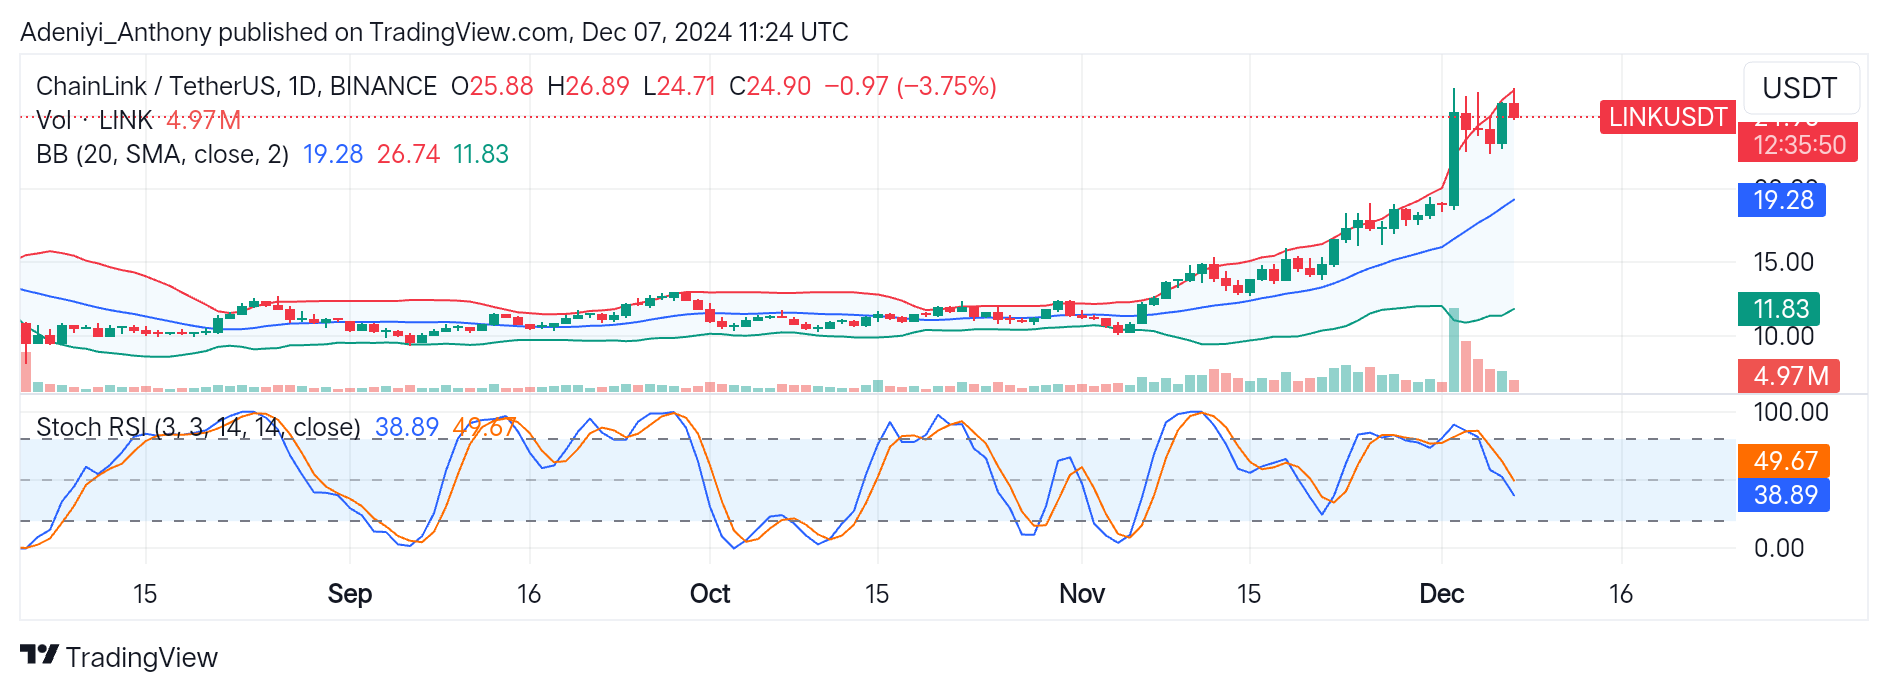
On a daily timeframe, LINK/USDT is experiencing a minor dip after testing the resistance at $26.74. Though the overall market sentiment is still bullish, the price is down by 3.75%. This suggests a strong momentum that might create room for more upside movement in the near term.
The Stochastic RSI suggests the pair might face some downside pressure if a bearish crossover is confirmed as lines of the indicator leave the neutral zone facing south.
To this end, traders should expect a pullback to $22.00 at the mid-band if current conditions persist; otherwise, a close above $25.00 could lead to testing of $26.74 or extend towards $30.00.
You can purchase crypto coins here. Buy Block