Chainlink Loses Value as It Risks Further Decline to $6.57
Estimated Reading Time: 2 minutes
Don’t invest unless you’re prepared to lose all the money you invest. This is a high-risk investment and you are unlikely to be protected if something goes wrong. Take 2 minutes to learn more

Chainlink (LINK) Long-Term Analysis: Bearish
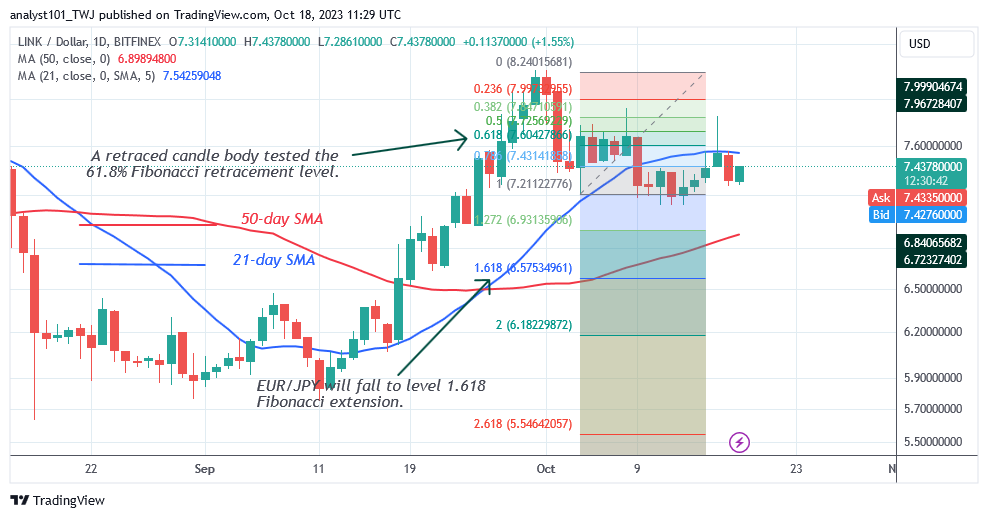
Chainlink’s (LINK) price has fallen below the 21-day moving average line as it risks further decline to $6.57. The price of LINK is lower than the 21-day SMA but higher than the 50-day SMA. Since October 1, the cryptocurrency asset has been declining. The asset’s overbought situation prompted the fall. The coin reached a high of $8.26 before being repulsed.
At the time of writing, the altcoin is worth $7.43 . On the plus side, the altcoin rebounded and was resisted twice at the $7.80 high. On the downside, bearish momentum will increase until it reaches support above the 50-day SMA. In other words, LINK/USD will decline to the $6.57 price level or the 1.618 Fibonacci extension level.
Technical indicators:
Major Resistance Levels – $8.00, $10.00, $12.00
Major Support Levels – $6.00, $4.00, $2.00
Chainlink (LINK) Indicator Analysis
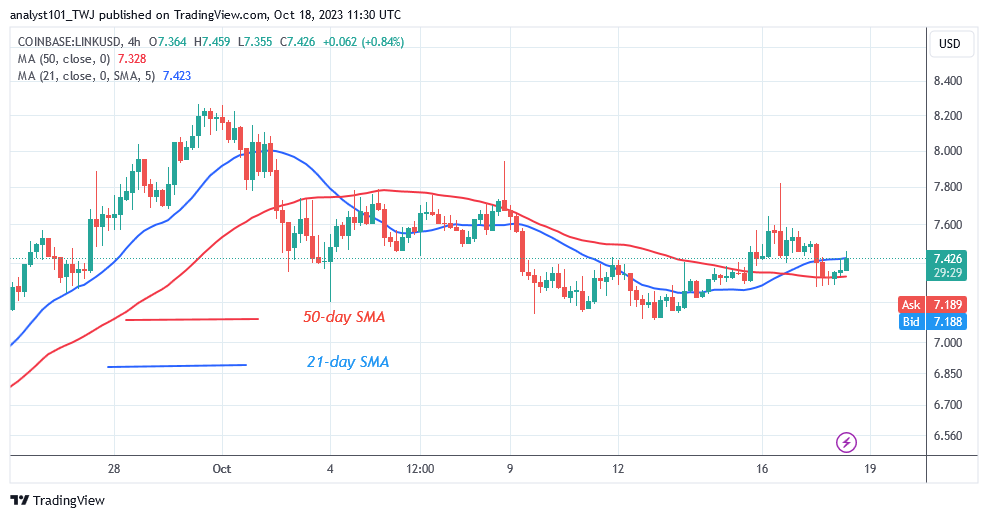
Since October 9, the price bars of the cryptocurrency have been caught between the moving average lines. The bulls attempted to breach the 21-day SMA on October 16 but were unsuccessful. The price of LINK will be compelled to fluctuate in a range as long as it is trapped between the moving average lines. Moving average lines have an upward slope that displays the prior trend.
What Is the Next Direction for Chainlink (LINK)?
Chainlink has room to fall even further as it risks further decline to $6.57. The 21-day SMA has stymied further upward movement. The coin is likely to fall above the 50-day simple moving average. However, if the altcoin falls below the 50-day simple moving average, selling pressure will resume.
You can purchase crypto coins here. Buy LBLOCK
Note: Cryptosignals.org is not a financial advisor. Do your research before investing your funds in any financial asset or presented product or event. We are not responsible for your investing result