Chainlink Reaches Overbought Region as It Struggles Below the $6.94 High
Estimated Reading Time: 2 minutes
Don’t invest unless you’re prepared to lose all the money you invest. This is a high-risk investment and you are unlikely to be protected if something goes wrong. Take 2 minutes to learn more
Chainlink (LINK) Long-Term Analysis: Ranging
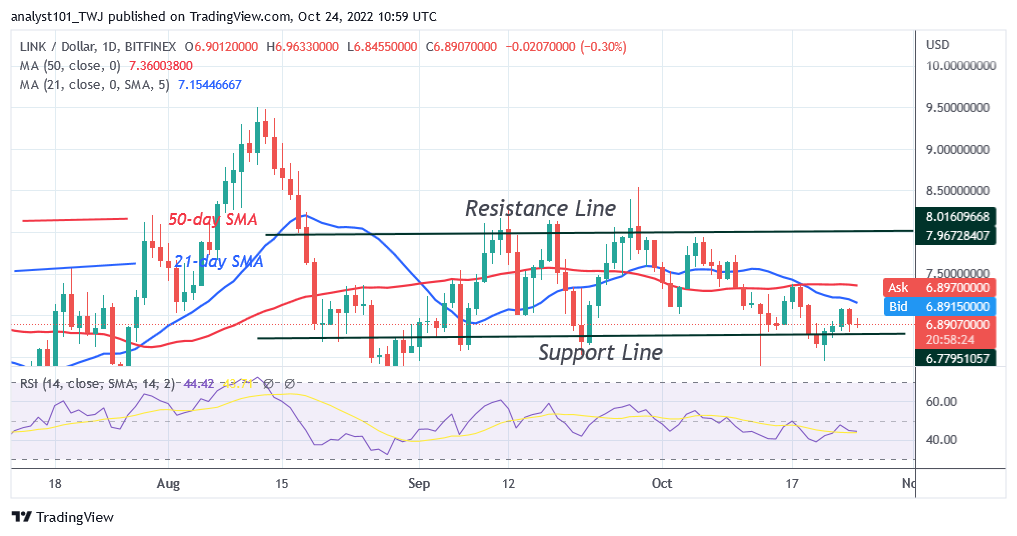
Chainlink (LINK) is in a downtrend as it struggles below the $6.94 high. Since October 13 price slump, the cryptocurrency has been confined to trade below the moving average lines. Today, the upward move is facing resistance at the 21-day line SMA. On the upside, a rebound above the current support will catapult the coin above the moving average lines. The bullish momentum will extend and retest the $8.00 high. Conversely, if Chainlink turns down from the 21-day line SMA, it will decline to the previous low at $5.70 price level.
Chainlink (LINK) Indicator Analysis
Chainlink is at level 45 of the Relative Strength Index for period 14. It is trading in the downtrend zone and may fall. LINK is above the daily stochastic 75% region. It is in a bullish momentum and approaches the overbought territory. The overbought area will see the emergence of sellers. Price bars for LINK are below the moving average lines, indicating a price fall.
Technical indicators:
Major Resistance Levels – $18.00, $20.00, $22.00
Major Support Levels – $8.00, $6.00, $4.00
What Is the Next Direction for Chainlink (LINK)?
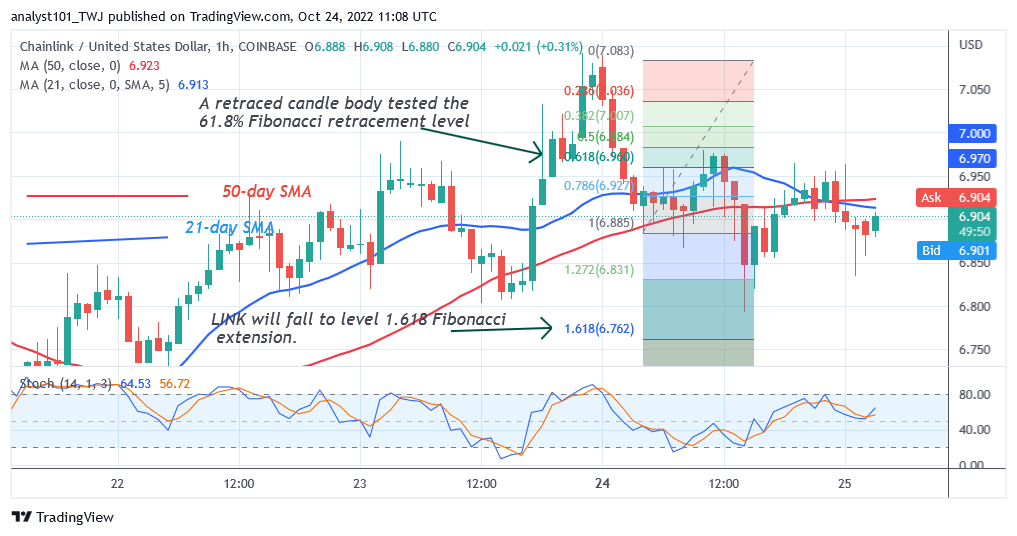
Chainlink is rising as it struggles below the $6.94 high. The current uptrend is doubtful as the cryptocurrency trades in the overbought region. The coin is likely to face rejection at the recent high.
You can purchase crypto coins here. Buy LBLOCK
Note: Cryptosignals.org is not a financial advisor. Do your research before investing your funds in any financial asset or presented product or event. We are not responsible for your investing results