Chainlink Reverses from the Downtrend as It Resumes Above $6.22
Estimated Reading Time: 2 minutes
Don’t invest unless you’re prepared to lose all the money you invest. This is a high-risk investment and you are unlikely to be protected if something goes wrong. Take 2 minutes to learn more

Free Crypto Signals Channel
Chainlink (LINK) Long-Term Analysis: Bearish
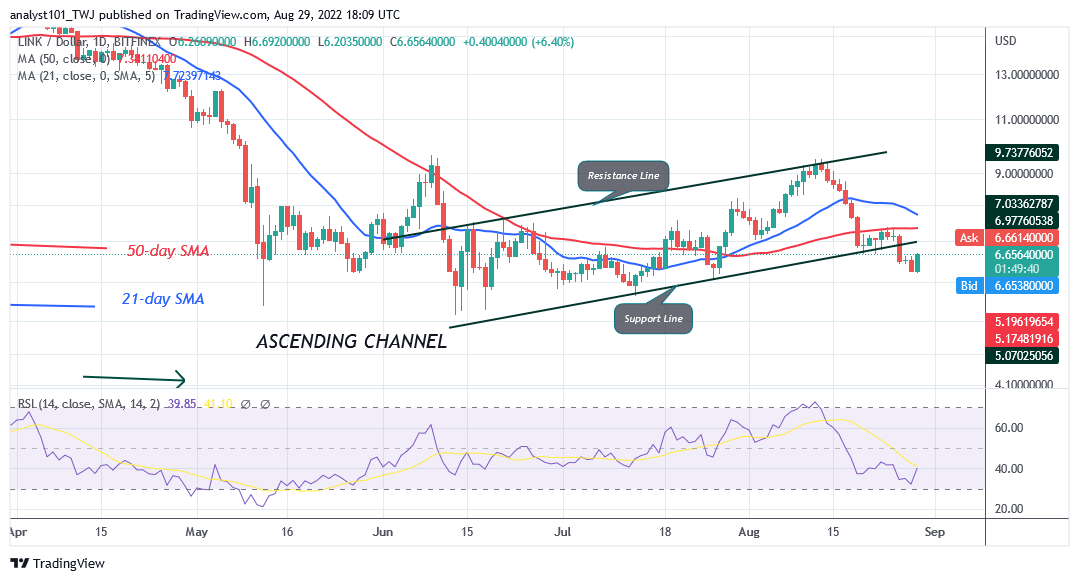
Chainlink (LINK) price is in a downtrend as it resumes above $6.22. The altcoin declined to the low of $6,22 and resumed fluctuation above the current support. The selling pressure was a gradual downward move. On August 19 price slump, the selling pressure subside as the altcoin corrected upward. The upward correction was terminated at the high of $7.37 as sellers pushed the altcoin to the low of $6.42. The current support is the previous low of July 26. The current support was holding as the cryptocurrency resumed upward. On the upside, the altcoin will rise and retest the initial resistance at $7.37. Further selling pressure is doubtful as the market reaches the oversold region. However, the LINK price may decline to $5.91 if the current support is breached.
Chainlink (LINK) Indicator Analysis
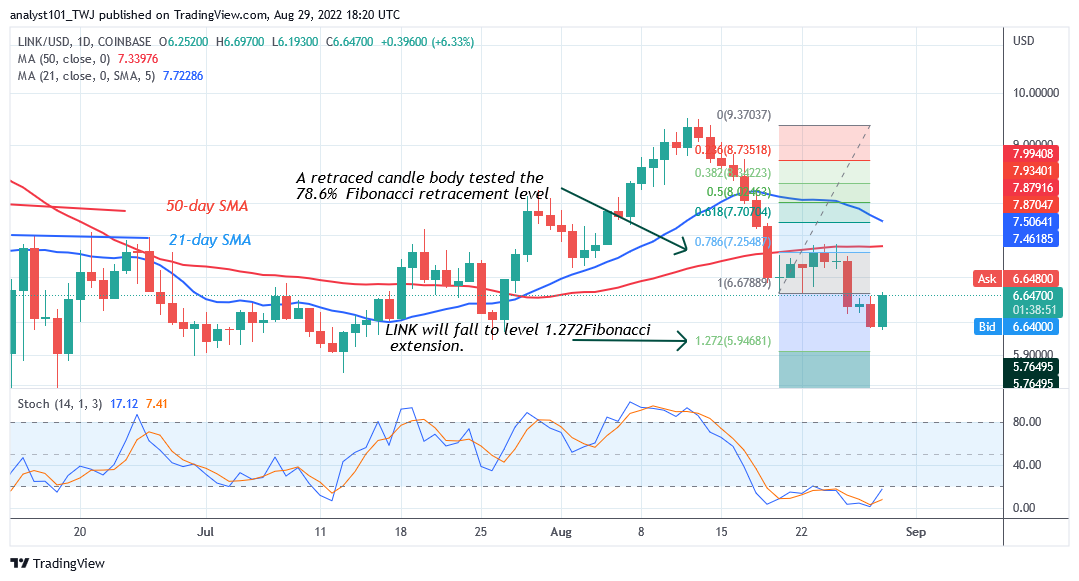
The altcoin is at level 36 of the Relative Strength Index for period 14. It is in the downtrend zone and may decline to the oversold region. The altcoin risks further decline as price bars are below the moving average lines. The altcoin is below the 20% range of the daily stochastic. It indicates that the market has reached the oversold region of the market.
Technical indicators:
Major Resistance Levels – $18.00, $20.00, $22.00
Major Support Levels – $8.00, $6.00, $4.00
What Is the Next Direction for Chainlink (LINK)?
Chainlink falls to the oversold region of the market as it resumes above $6.22. Meanwhile, on the August 20 downtrend, a retraced candle body tested the 78.6% Fibonacci retracement level. The retracement suggests that LINK will fall but reversed at level 1.272 Fibonacci extension or level $5.94.
You can purchase crypto coins here. Buy LBLOCK
Note: Cryptosignals.org is not a financial advisor. Do your research before investing your funds in any financial asset or presented product or event. We are not responsible for your investing results