Chainlink Swings To Its Range As It Faces Resistance At $19
Estimated Reading Time: 2 minutes
Don’t invest unless you’re prepared to lose all the money you invest. This is a high-risk investment and you are unlikely to be protected if something goes wrong. Take 2 minutes to learn more

Chainlink (LINK) Long-Term Analysis: Bullish
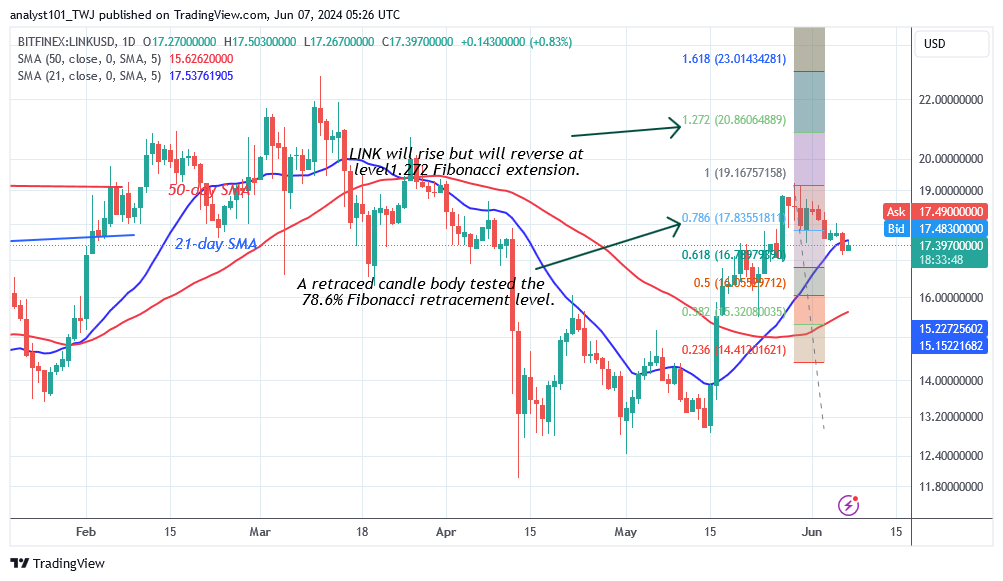
Chainlink’s (LINK) price has fallen below the 21-day SMA as it faces resistance at $19. The bearish impetus has been expended, and the altcoin has resumed its upward trend. If buyers sustain the price above the 21-day SMA, the LINK price may advance to its prior high of $19. Currently, the altcoin is below the 21-day SMA but above the 50-day SMA.
On the downside, the LINK will price fall above the 50-day SMA or $15.70 support if it is rejected at the 21-day SMA. Chainlink is worth $17.55 at the time of writing.
Technical indicators:
Major Resistance Levels – $20.00, $22.00, $24.00
Major Support Levels – $12.00, $10.00, $8.00
Chainlink (LINK) Indicator Analysis
LINK prices are trending upward, signaling a rally under pressure from bears. Bears have broken the 21-day SMA support, which may lead to the cryptocurrency’s drop. However, the bulls are retesting the moving average line in an attempt to recapture the 21-day SMA support level.
What Is the Next Direction for Chainlink (LINK)?
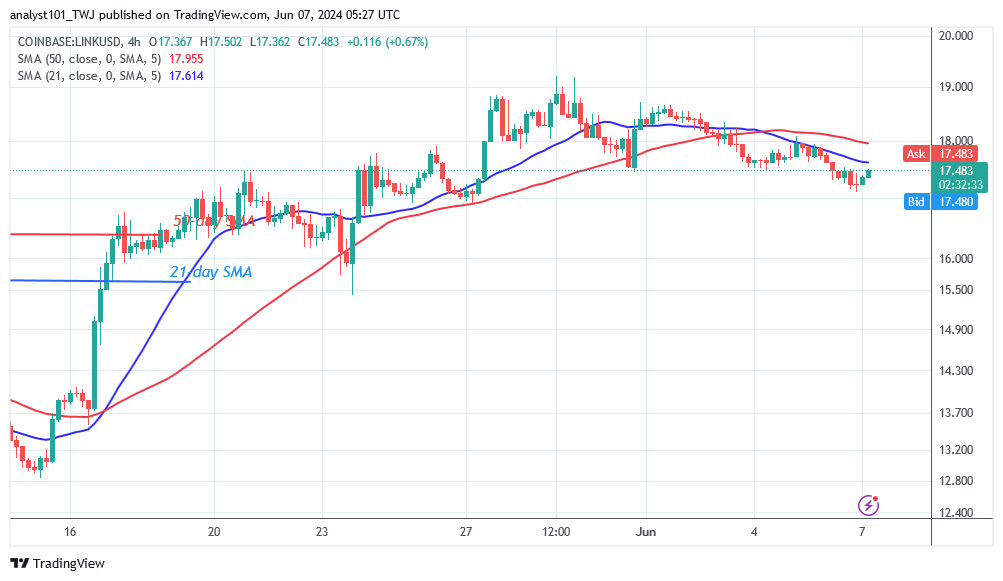
On the 4-hour chart, Chainlink has fallen below the moving average lines as it faces resistance at $19. The altcoin has reached bearish exhaustion, reaching a low of $17.10. The current support level of $17.10 is the historical price level of May 25, 2024. The bears have yet to break through the present support in the last month. Meanwhile, the crypto signal is bullish because it is within the bullish trend zone.
You can purchase Lucky Block here. Buy LBLOCK
Note: Cryptosignals.org is not a financial advisor. Do your research before investing your funds in any financial asset or presented product or event. We are not responsible for your investing result