0x (ZRXUSD) Posts Bullish Market Structure
Estimated Reading Time: 3 minutes
Don’t invest unless you’re prepared to lose all the money you invest. This is a high-risk investment and you are unlikely to be protected if something goes wrong. Take 2 minutes to learn more
Market Analysis-ZRXUSD Market Structure Becomes Bullish
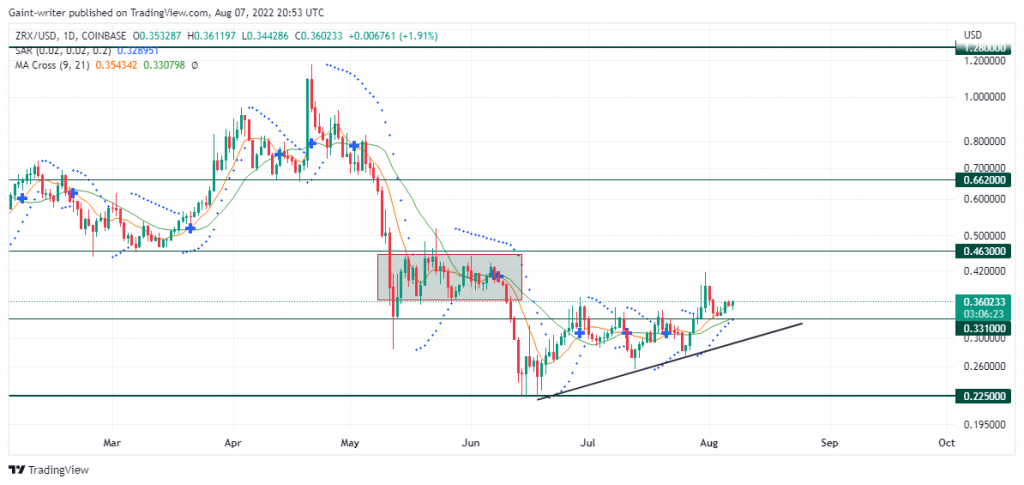
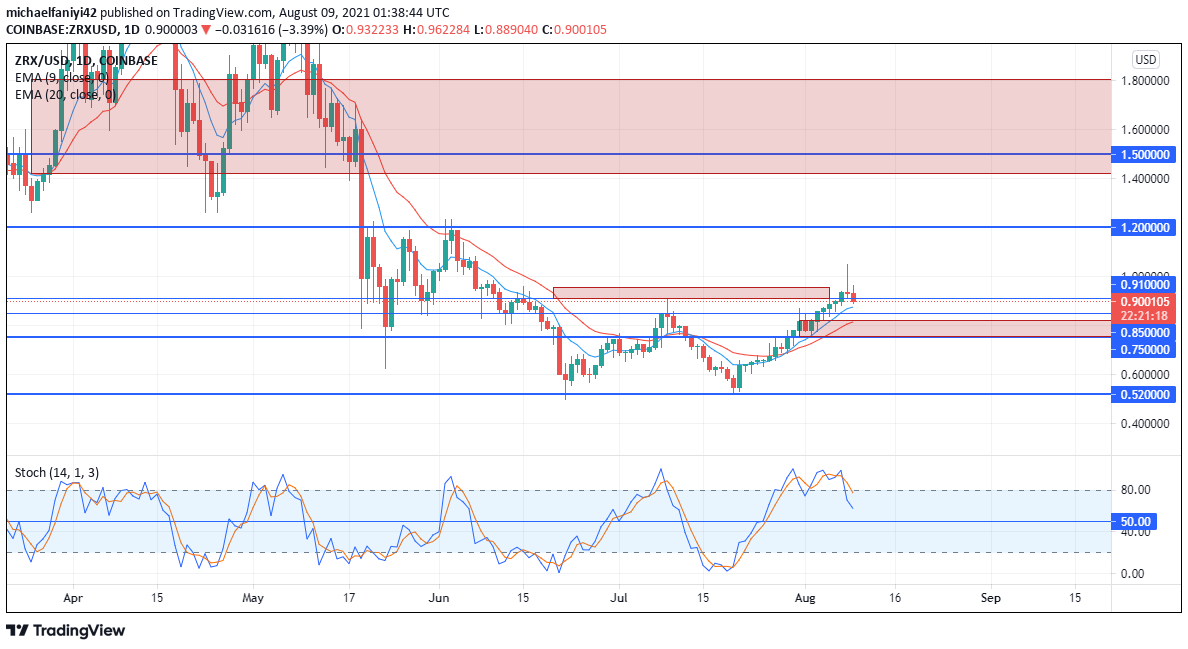
ZRXUSD bullish market structure has been formed after it broke through a previously highlighted resistance level at $0.910. The coin’s bullish run started after price initially retraced at the $0.850 level on the 1st of August. Price held steady and gathered more momentum as the bulls added more longs to their portfolio at $0.750, then sent price racing through the resistance barrier above it. The impulse of the move was strong on the coin. It gained 40% in seven days of bullishness.
Key Levels
Resistance Levels: $0.910, $1.200, $1.500
Support Levels: $0.850, $0.750, $0.520
From the stochastic indicator on the chart of the daily timeframe, it is revealed that the ZRXUSD market structure is extremely bullish. The indicator line, which reveals the speed and momentum of price movement, shows price is trading deeply in the 100.00 overbought level.
At this point, the bullish side of the market looks exciting to be a part of, and further price levels such as $1.200 and $1.500 exist above that the market could still trade well into in the coming days. However, since the stochastic indicator shows price is in a heavily overbought area, a more conservative approach to joining the longs would be to wait for a retracement of price to the 50.00 level of the stochastic, which would be an equilibrium level of price, before placing a buy order.

Market Prospects
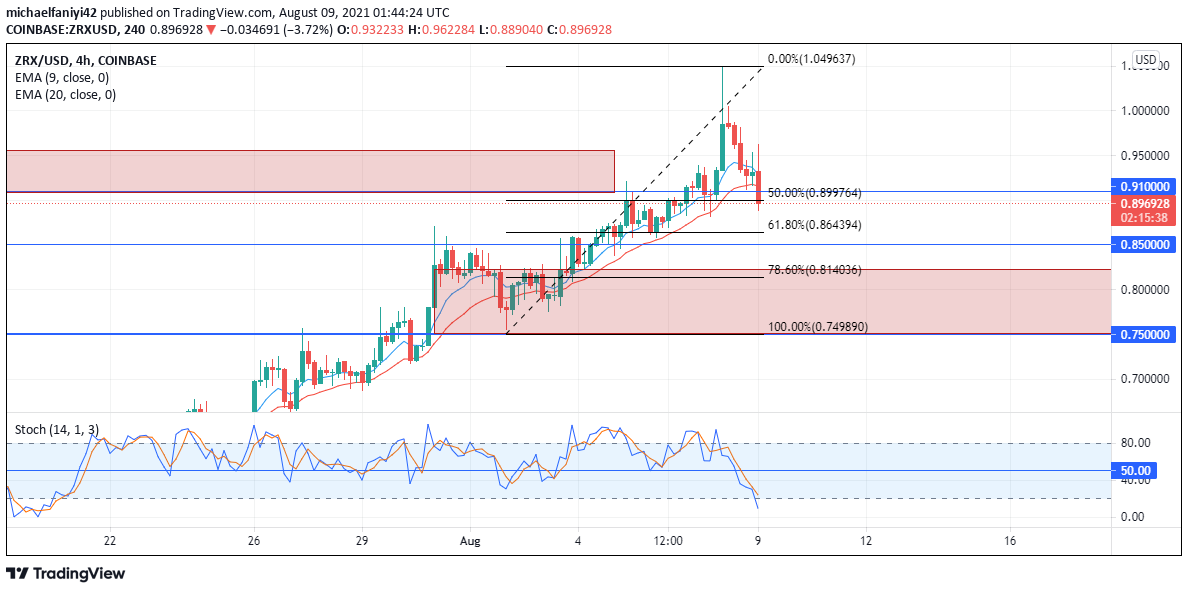
We can further refine our potential entry point to join the longs on the 4H chart also. If we plot the Fibonacci tool from the most recent support level of $0.750 to the most recent short-term high at $1.050. We can observe that 78% of the Fib, which is our optimum entry point, finely correlates with the bullish candlestick reversal pattern that was formed at the base of the support level. If price retraces to this level and the stochastic happens to be in the oversold region also, this confluence of ideas will present us with an optimal entry to join the buy-side.
The ZRXUSD market structure looks very bullish. With the buyers increasing their hold on the market, it would suffice therefore that after the coin retraces, it should still attack the resistance point at $1.20, perhaps break it and then drive up into the $1.50 level in the coming days.
You can purchase crypto coins here: Buy Tokens
Note: Cryptosignal.org is not a financial advisor. Do your research before investing your funds in any financial asset or presented product or event. We are not responsible for your investing results.