Annual Forecast for Bancor (BNTUSD) (2022)
Estimated Reading Time: 3 minutes
Don’t invest unless you’re prepared to lose all the money you invest. This is a high-risk investment and you are unlikely to be protected if something goes wrong. Take 2 minutes to learn more
Bancor Annual Forecast – The Market Is Locked in a Monthly Consolidation
Bancor annual forecast sways the market in favor of the buyers. This is despite the fact that the coin has been locked in a monthly tussle between buyers and sellers. Price consolidation began in July 2022 as the market quickly recovered from a slump from the $7.450 resistance level. The price clung onto the $3.150 support from where it rose. However, the market was prevented from rising further at $4.900 despite several attempts.
Bancor Significant Levels
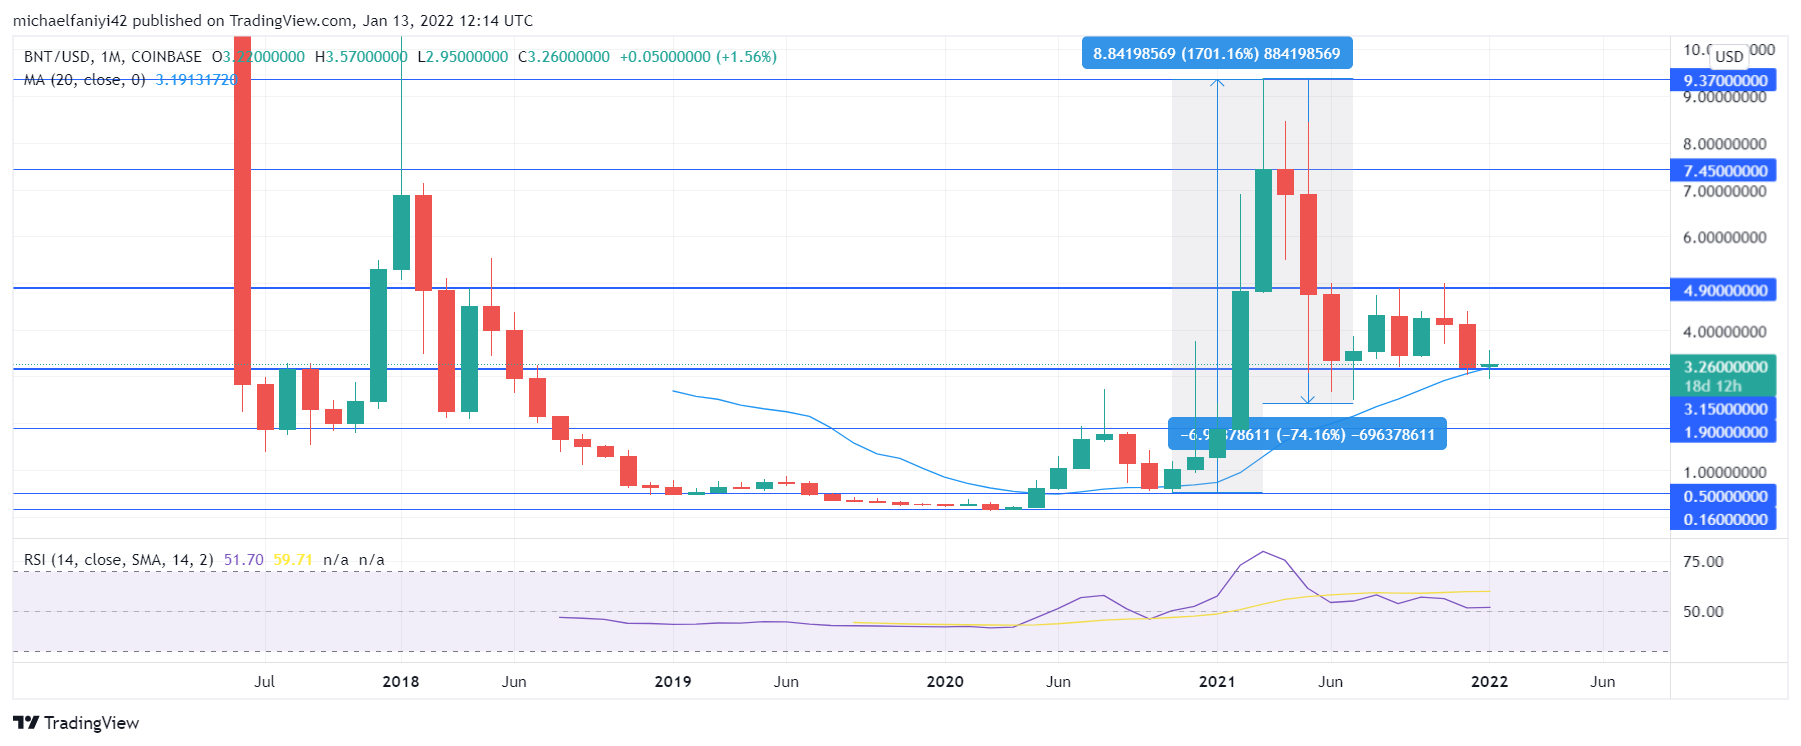
Resistance Levels: $4.900, $7.450, $9.370
Support Levels: $3.150, $1.900, $0.500
Bancor Long Term Plan: Ranging
Bancor suffered from severe depression right from the start of the year 2019. This spanned till the first quarter of 2020. By the beginning of May 2020, the buyers were let off the hook and the first major price increase in over a year ensued. A retracement back to a slightly higher support level of $0.500 enabled the coin to experience a price surge into 2021, peaking at $9.370, a price increase of over 1700%.
Market forces began a correction exercise, which led to almost a 75% drop. However, Bancor would not be taken back into depression, hence the price recovers above $3.150. From there, bulls have been battering the $4.900 resistance as the forecast indicates the price is aiming for $7.450. The RSI (Relative Strength Index) indicator is hovering above the 50 mark, indicating a bullish bias. Meanwhile, the MA (Moving Average) period 20 solidifies price support.

Bancor Medium Term Plan: Bullish
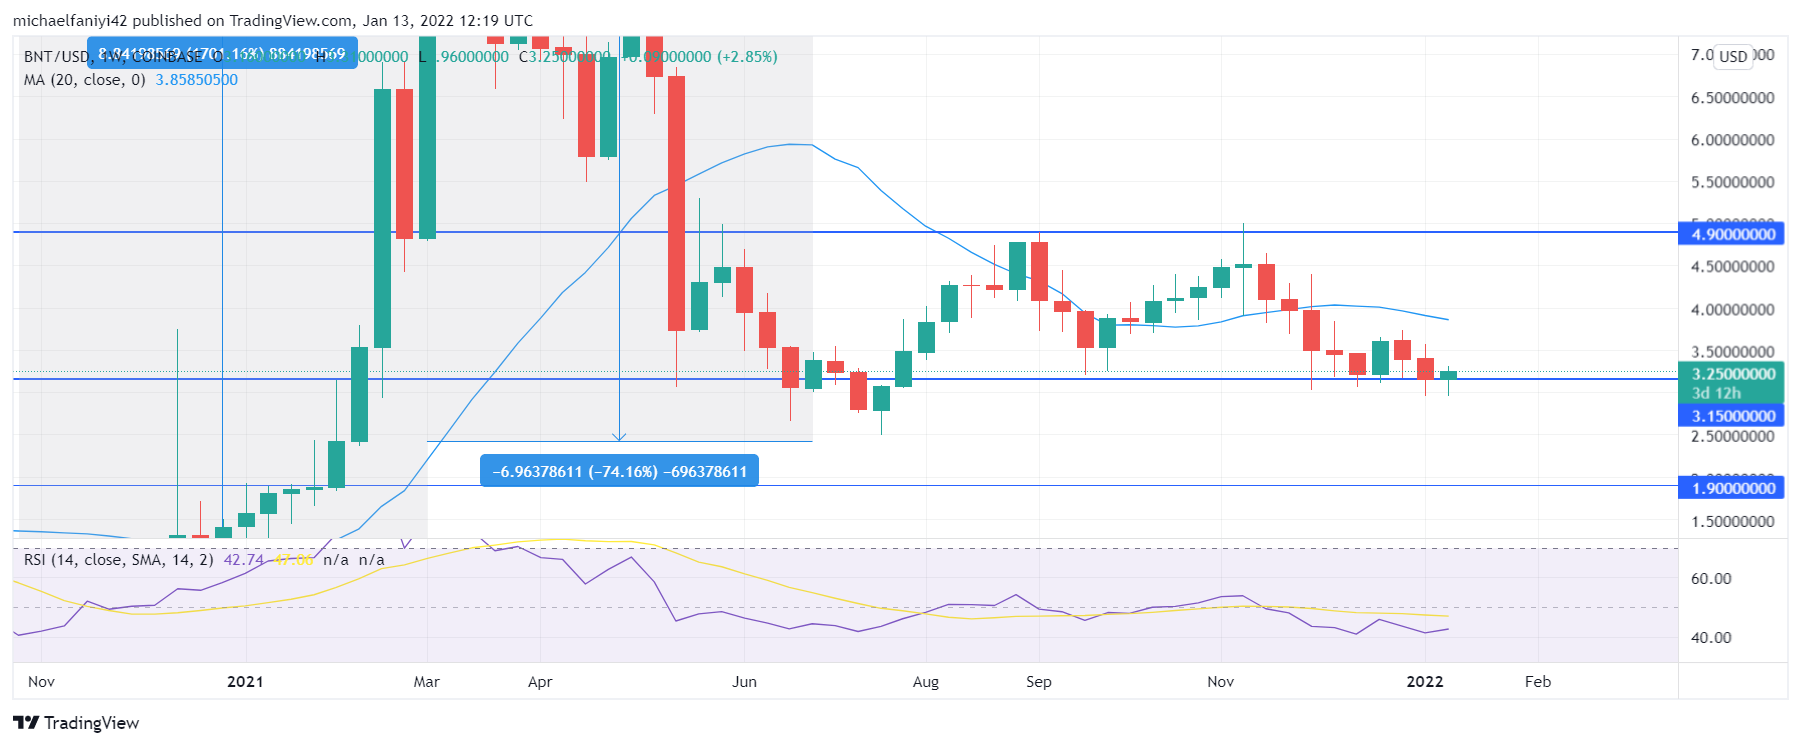
Bancor continues to undulate between the $4.900 and the $3.150 significant levels. Currently, the price has dropped to the support level and is assuaging to rise again. On the weekly chart, the bears have the upper hand, and the RSI line has dropped below the 50 mark. The MA period 20 is also currently acting as a barrier to the market uprising. Buyers will have to overthrow the bearish forces to keep undulating and fulfill the annual forecast of reaching $7.450.
You can purchase crypto coins here: Buy Tokens
Note: Cryptosignals.org is not a financial advisor. Do your research before investing your funds in any financial asset or presented product or event. We are not responsible for your investing results.