Annual Forecast for Litecoin (2022) LTC/USD
Estimated Reading Time: 3 minutes
Don’t invest unless you’re prepared to lose all the money you invest. This is a high-risk investment and you are unlikely to be protected if something goes wrong. Take 2 minutes to learn more
Litecoin Annual Price Forecast
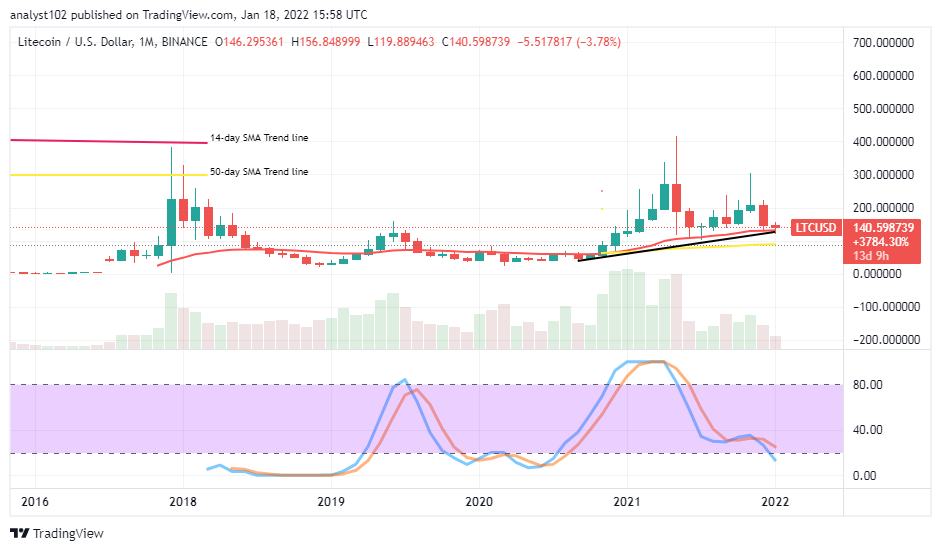
The LTC/USD market annual forecast financial book records that the crypto-economic market firstly approached a higher value line of $400 during December 2017 operations but briefly broke past the point during May 2021 sessions. Between 2018 and January 2021, prices traded below the $200 line. The market is currently within the valuation lines of $156 and $119, keeping the percentage rate of about 3.78 negatives.
LTC/USD Market
Key Levels:
Resistance levels: $200, $300, $400
Support levels: $100, $80, $60
LTC/USD – Monthly Chart
The LTC/USD market annual forecast monthly chart showcases the crypto-economic price reverses momentums southward towards the SMA trend lines. The 14-day SMA indicator is above the 50-day SMA indicator. The upward trend line drew tightly beneath the smaller SMA playing supportive purposes to it as there has been a smaller bearish candlestick in the making, averaging them closely. The Stochastic Oscillators have crossed their lines northbound briefly past the range of 20 to signify the falling forces that have dominated the crypto activities.
The LTC/USD market annual forecast, should traders remain looking for more downward entries this year than ups?
Based on the technical trading approach and, probably, the current trading cycle, there will be more successful sell orders in this year’s LTC/USD market annual forecast as it has already begun unmindfully during the last May trading sessions. There will be less-active upward motions at lower support levels and, that is calling for a total cautiousness against just exerting a buy order at a free will. Meanwhile, long-term investors may have to get repositioned to add more to their portfolios, especially when the market goes more dipping afterward.
On the downside of the technical analysis, the last month, December bearish candlestick; formed against the $200 level to the downside to creating a selling wall against some attempted upward swings that the market may be making efforts to prelaunch back to the northward trend. The market is on the verge of losing further in the long run toward the lower support level of l$100. That presumption may have to play out in a slow-and-steady-moving style. In other words, the downward motion does not seem to feature higher volatility.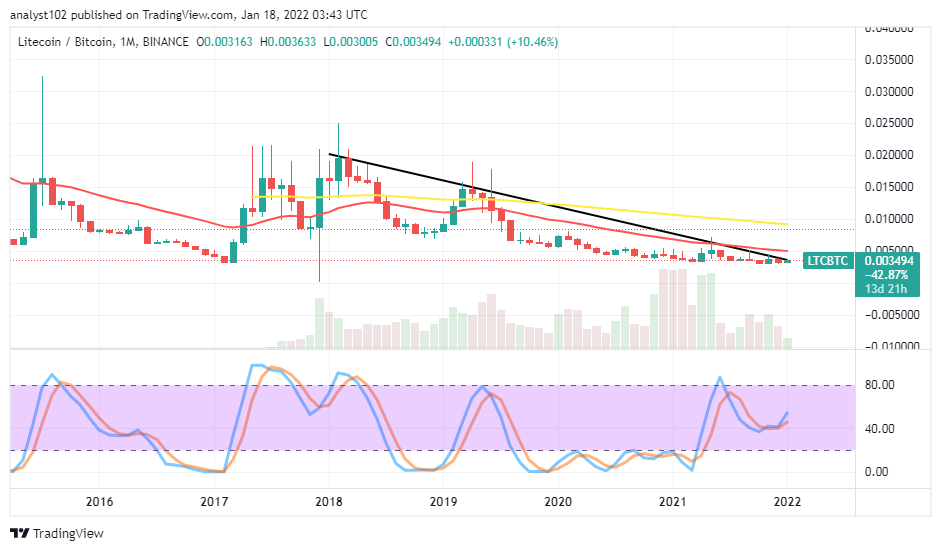
LTC/BTC Monthly Price Analysis
In comparison, the LTC/BTC market annual forecast price analysis chart showcases the cryptocurrency pair economy trades below the trend lines of the SMAs. The 50-day SMA indicator is above the 14-day SMA indicator. The bearish trend line drew southward across the SMAs to place a markdown note on the last forming candlestick. The Stochastic Oscillators have moved southbound to cross their lines briefly northbound from the range of 40. That suggests that the base crypto is struggling to push against the stances of the flagship crypto. The crypto pair market may still run under a declining force beneath the trend lines of the trading SMAs for some more time.
Note: Cryptosignals.org is not a financial advisor. Do your research before investing your funds in any financial asset or presented product or event. We are not responsible for your investing results.
You can purchase crypto coins here. Buy Tokens