Bancor (BNTUSD) Continues Cranking Movement
Estimated Reading Time: 2 minutes
Don’t invest unless you’re prepared to lose all the money you invest. This is a high-risk investment and you are unlikely to be protected if something goes wrong. Take 2 minutes to learn more
Market Analysis – Bancor Continues Cranking Between $3.530 and $2.840
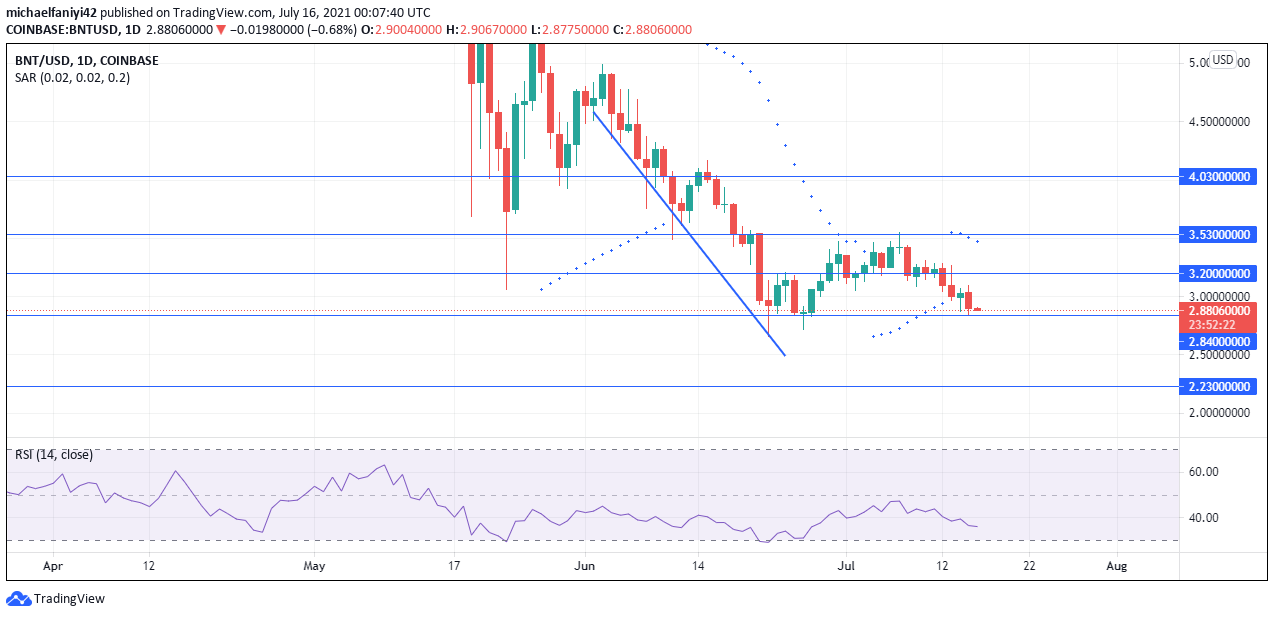
Bancor cranking movement continues after it was rejected at the $3.530 supply level. Sellers have been steadily plunging the market since the 2nd of June 2021. However, the price drop was brought to a screeching halt at the $2.840 demand zone. From this zone, the buyers have been working to lift the price.
The first attempt by buyers to lift the coin met resistance at $3.200. A second trial moved the market above the resistance level. Price then bounced off $3.200 as a support to continue the bullish impulse, but the $3.530 resistance defended the price thoroughly. At the third time of trial, the price displayed a spinning top candle to show market indecision. Thereafter, the price utterly failed and fell back to the support and below to the next support.
The Parabolic SAR (Stop and Reverse) since four days ago already signaled a downturn in price with four dots aligned above the daily candles. The RSI (Relative Strength Index) has always been dipping gently since hitting a peak on the 7th of July when price displayed the spinning top candlestick for market indecision. It reflects general price bearishness.
Bancor Key Levels
Resistance Levels: $3.530, $3.200
Support Levels: $2.840, $2.230
Market Anticipation
The 4-hour chart shows that the market has been on a decline since hitting the $3.530 resistance for the third time. Price is now at a crucial junction in which it can either fall further or leverage the support at $2.840 to spring back up.
The Parabolic SAR has aligned its dots firmly above the 4-hour candles to show price bearishness. This is the same situation with the RSI, whose signal line at 33.18 is now hovering above the oversold region.
Except for a very strong bullish persistence, the market is expected to fall towards the next support at $2.300.
You can purchase crypto coins here: Buy Tokens
Note: Cryptosignal.org is not a financial advisor. Do your research before investing your funds in any financial asset or presented product or event. We are not responsible for your investing results.