BCH/USD Holds Near $516.00 as Sellers Press Momentum Into Oversold Territory
Estimated Reading Time: 3 minutes
Don’t invest unless you’re prepared to lose all the money you invest. This is a high-risk investment and you are unlikely to be protected if something goes wrong. Take 2 minutes to learn more

BCH/USD Price Analysis – February 04, 2026
Bitcoin Cash (BCH/USD) continues to trade under sustained bearish pressure, with price action rejecting below the $612.00 important level. Sellers remain in control across multiple timeframes, and momentum indicators lean decisively bearish. However, early oversold signals are starting to emerge, suggesting that a short-term relief bounce is possible if demand re-enters the market.
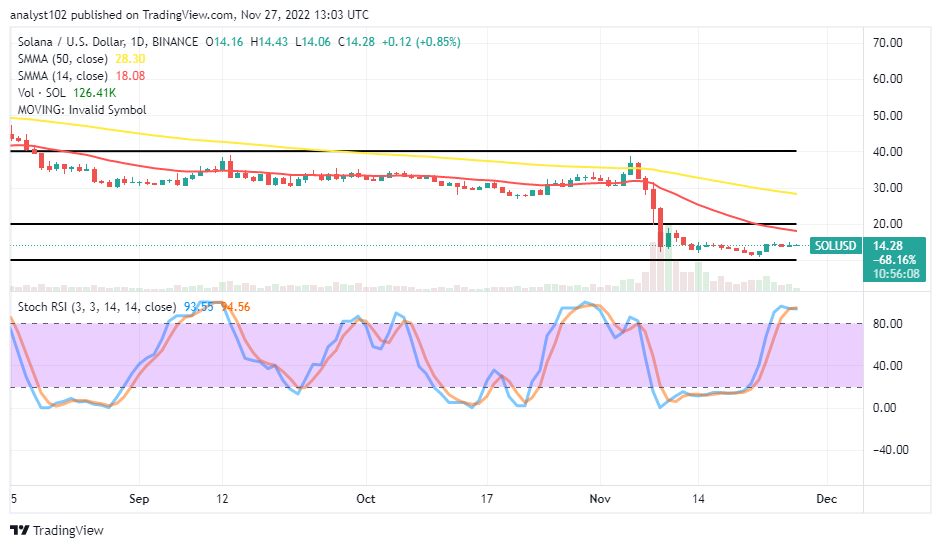
BCH/USD Daily Chart (Daily Key Levels):
Support Zones: $520.07, $446.57
Resistance Zones: $612.92, $650.72

BCH/USD Long-Term Trend – Bearish (Daily Chart)
BCH/USD is currently trading around $516.50, down approximately 2.77% on the session. On the daily timeframe, the Stochastic oscillator sits near 36.22, indicating weak momentum and lack of strong buying support.
$BCH Snapshot
Price Action: Bitcoin Cash is currently trading at $537.4, with the most recent candle closing at this level after opening at $532.5. The high for the most recent candle reached $542.6, while the low was $529.2.
Sentiment: Neutral.
Technicals: $BCH is trading… pic.twitter.com/kDMRbztzuF
— Punkchainer (@PunkChainer) February 5, 2026
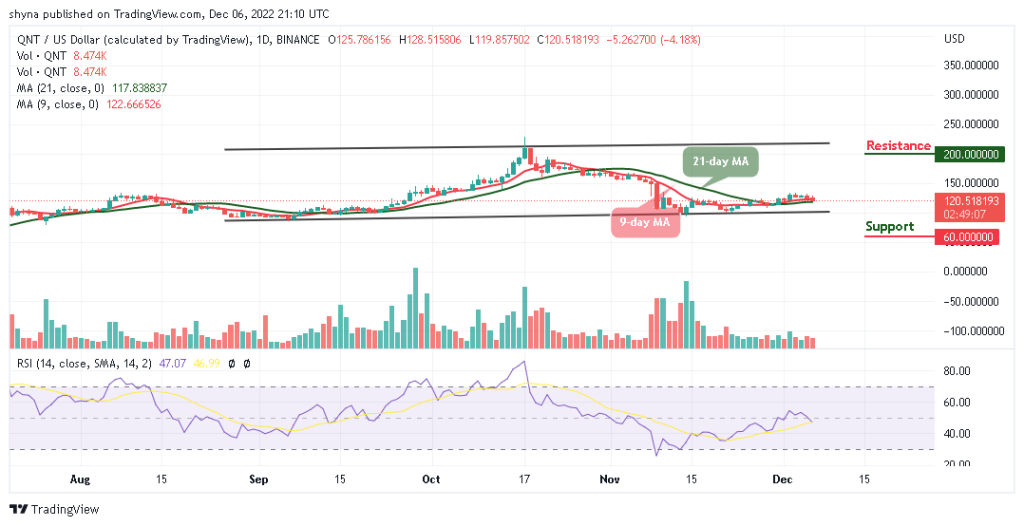
What is BCH/USD Market Outlook?
The Moving Average Cross shows the short-term MA at $536.80 below the long-term MA at $566.70, confirming that bearish momentum is still in force. Price recently printed a rejection from $650.72 and has been forming consistent lower lows throughout the entire downtrend. This shows a structure typically associated with seller dominance and weak buyer participation.
The market remains in a defined downtrend. A failure to reclaim $612.92 with conviction increases the likelihood of continued downside pressure. The next major support lies at $520.07, with a deeper target toward $446.57 if that level fails to hold.
Alternatively, a clean reclaim of $612.92 with volume and follow-through would reduce short-term bearish bias. It could spark a short-covering rally toward $650.72 and eventually $700.00.

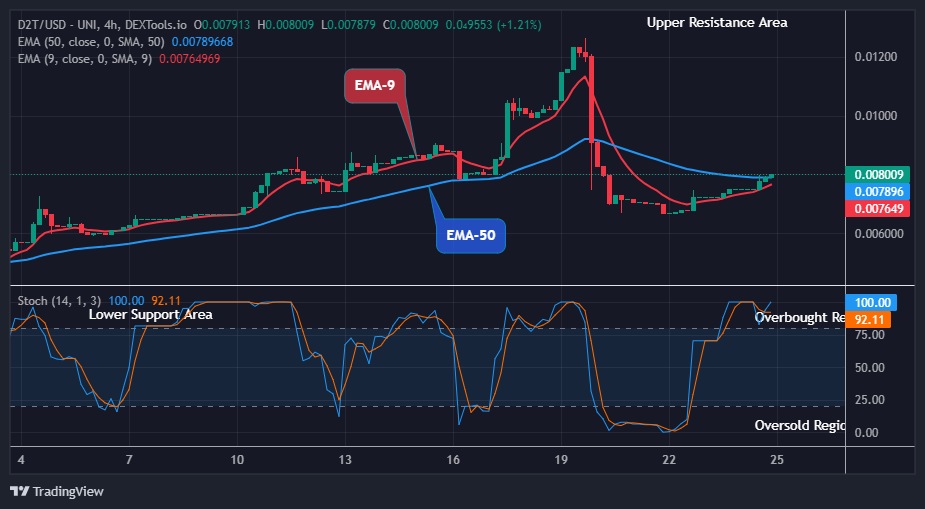
BCH/USD Short-Term Trend – Bearish (4 Hour Chart)
On the 4 Hour timeframe, BCH/USD is showing persistent short-term weakness. Price is trading near $516.30 with lower highs and lower closes developing across the recent range.
The Stochastic oscillator reads 22.69, reflecting intense selling pressure at the intraday level. The Moving Average Cross shows the 9 MA at $528.00 decisively below the 21 MA at $527.46, confirming short-term bearish momentum remains entrenched.
BCH/USD Market Statistics
Current Price: $516.38
Market Capitalization: $10.2 Billion
24H Trading Volume: $385 Million
Place winning BCH trades with us. Get BCH here