Bitcoin (BTC/USD) Market Forms Bullish Momentum Around Key Support Zones
Estimated Reading Time: 2 minutes
Don’t invest unless you’re prepared to lose all the money you invest. This is a high-risk investment and you are unlikely to be protected if something goes wrong. Take 2 minutes to learn more

Bitcoin Price Prediction – September 19
BTCUSD market forms bullish momentum around key support zones. A retraction from the bullish order block below $56500 support might result in a significant pullback.
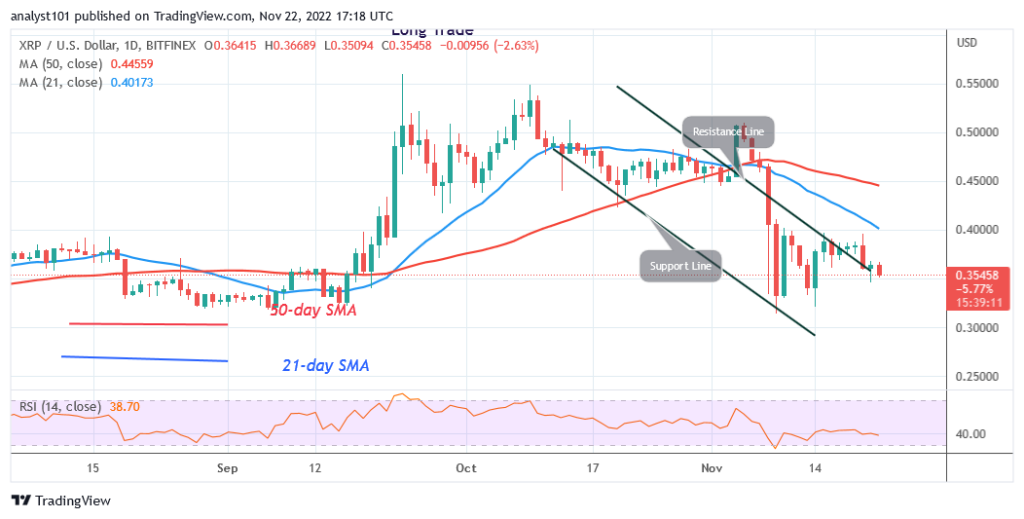
The RSI (Relative Strength Index) on this chart shows a gradual recovery from oversold territory, indicating potential bullish momentum. It is currently hovering around the neutral 50 zone, suggesting that the market is consolidating. Additionally, Moving Averages are starting to align, signaling a potential reversal from bearish to bullish. The convergence of these indicators points to a possible bullish trend ahead.
BTC/USD Market Key Levels:
Resistance Levels: $61910, $73840, $80000
Support Levels: $56500, $49050, $45000
BTC/USD – Daily Chart
The BTCUSD daily chart shows that the market is set to continue its overall bullish trend.
Price action reveals a clear formation of higher lows. This formation indicates a high possibility of the continuation of the bullish trend. An invalidation of the $61910 might cause a massive rally further to the upside.

What are the potential price targets for BTCUSD in the near future?
Should the price retrace downward, the retracement is not expected to break beyond the emerging rising trendline. BTCUSD will likely retract from the bullish order block as it resumes its overall bullish trend.

BTC/USD – Four-Hour Chart
The BTCUSD pair is currently hovering around $59520, showing signs of a potential bearish reversal on the four-hour chart. The RSI is near 51, signaling market indecision but leaning towards a downside move. A break below the ascending trendline would confirm bearish pressure, targeting the $56500 level and potentially moving towards the fair value gap (FVG) and order block.
Bitcoin (BTC) Current Statistics
The current price: $59520
Market Capitalization: $1,240,000,000,000
Trading Volume: $49,980,000,000
You can purchase Bitcoin here. Buy BTC