Bitcoin (BTC/USD) Market Stretches Positions Over $20,000
Estimated Reading Time: 3 minutes
Don’t invest unless you’re prepared to lose all the money you invest. This is a high-risk investment and you are unlikely to be protected if something goes wrong. Take 2 minutes to learn more
Bitcoin Price Prediction – October 26
Presently, the trading activity in the BTC/USD trade operations has shifted in favor of the upside direction as the crypto-economic market stretches positions over the $20,000 line. Price has been between the high and the low of $20,307.47 and $20,038.32 value lines at an average rate of 0.74% positive.
BTC/USD Market
Key Levels:
Resistance levels: $22,500, $25,500, $27,500
Support levels: $17,500, $15,000, $12,500
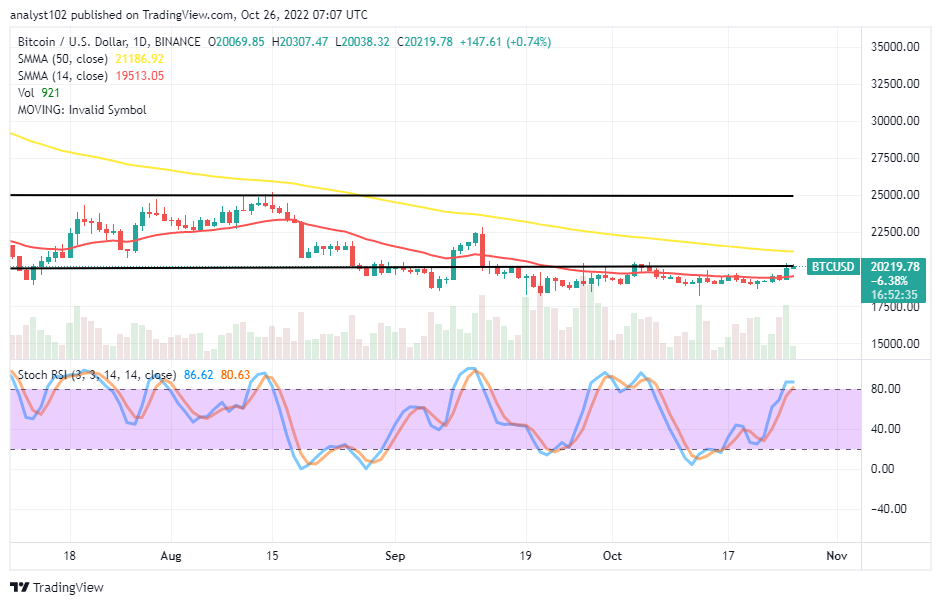
BTC/USD – Daily Chart
The BTC/USD daily chart reveals the crypto market stretches positions over the $20,000 psychological trading line after a long line featuring lower lows of variant lengths below the value line. The 14-day SMA indicator is at $19,513.03, underneath the $21,186.92 point of the 50-day SMA indicator. The horizontal lines remain drawn to indicate the market is trading in a deeper lower-range trading spot over time. The Stochastic Oscillators have moved into the overbought region at 80.63 and 86.62 range values. And they are seemingly attempting to close their lines soon.
Will there soon be a pit stop in the current BTC/USD market northward stretches?
Indications are showing there can be a possibility of the BTC/USD market operations to experience a pit stop, possibly around the point of the 50-day SMA trend line as the crypto market stretches positions over the $20,000 logical level. The bullish momentum is still on, holding firmer against a downward force around the psychological trading spot. The reading of the Stochastic Oscillators suggests a warning signal for buyers to be cautious of the execution of new longing entries at this point.
The downside of the BTC/USD technical analysis suggests that the market has reached a peak above the $20,000 level. However, the BTC/USD market sellers are to be on the lookout for a convergence of candlesticks carrying several rejections before considering a comeback. The resistance level around the $22,500 needs not to breach out to let short-position placers have a good re-opening shorting order afterward.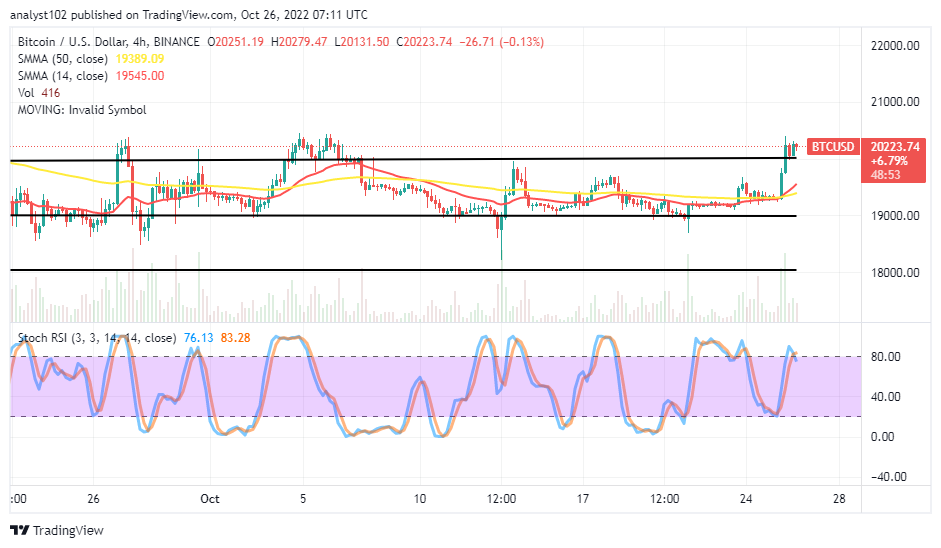
BTC/USD 4-hour Chart
The BTC/USD medium-term chart showcases the crypto market stretches positions over the $20,000 critical level of the three horizontal lines drawn. The other horizontal lines are at the $19,000 and $18,000 levels. And they represent range-bound spots at a particular point in time in the previous trading sessions. . The 14-day indicator is at $19,545, above the $19,389.09 value line of the 50-day SMA indicator. The Stochastic Oscillators are attempting to cross their lines southbound at 83.28 and 76.13 range values to signify the possibility of a rise that might have reached.
Note: Cryptosignals.org is not a financial advisor. Do your research before investing your funds in any financial asset or presented product or event. We are not responsible for your investing results.
You can purchase Lucky Block here. Buy LBLOCK