Bitcoin (BTC/USD) Trade Has Exploded, Breaking Range Resistance
Estimated Reading Time: 3 minutes
Don’t invest unless you’re prepared to lose all the money you invest. This is a high-risk investment and you are unlikely to be protected if something goes wrong. Take 2 minutes to learn more
Bitcoin Price Prediction – June 21
The Bitcoin market explodes, breaking through the range resistances of the US currency after finding support around the line of $25,000 of the lower main range support at $26,000.
In the last several hours of today’s session, bears have been overwhelmed by the presence of bulls between a low of $28,315.34 and a high of $30,277.07, with an estimated 6,64 percent positive rate. Buying activities have reached a peak range trade zone that is critically posing an unsafe push further to the moon direction to call for a wariness moment by the long-position takers.
BTC/USD Market
Key Levels:
Resistance levels: $31,000, $32,000, $33,000
Support levels: $29,000, $28,000, $27,000
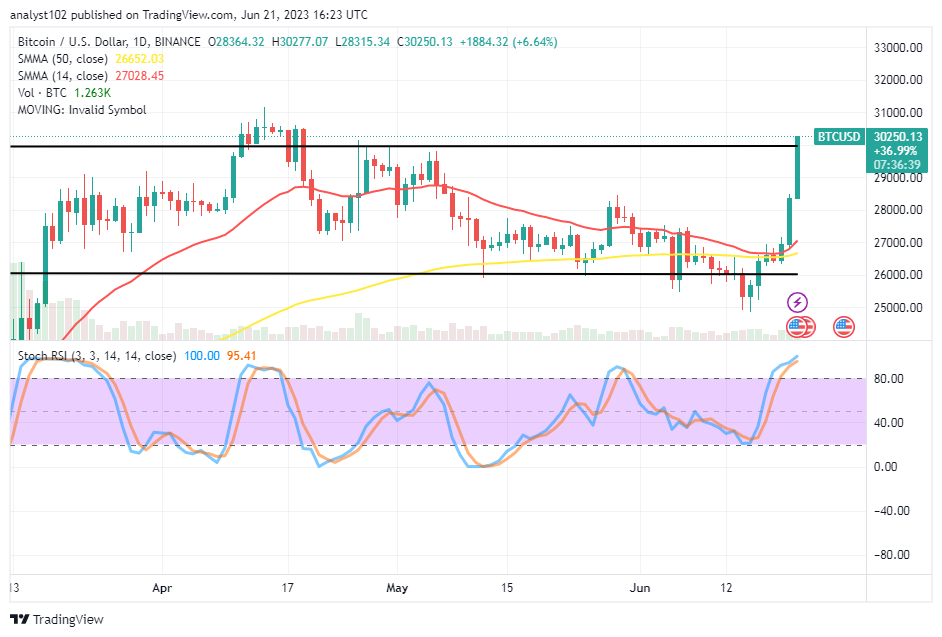
BTC/USD – Daily Chart
The BTC/USD daily chart showcases that the cryptocurrency economic market has exploded, breaking range resistances after securing a bottom candlestick during the 15th trading cycle to mark the end of a decline that broke the support at the $26,000 lower range level.
The occurrence of the bullish candlesticks has put the indicators in a lagging position, as the 14-day SMA is at $27,028.45, above the $26,652.03 value line of the 50-day SMA. The Stochastic Oscillators have reached the overbought region, portraying an extreme presence sign between 100 and 95.41 levels.
With the rising pressures in the BTC/USD trade, can there be more sustainable further pull-ups?
It would require the BTC/USD trade long-position placers lots of efforts to instill more gravitational forces, given that the crypto-economic market explodes, breaking range resistances slightly beyond the point of $30,000.
The northward trade technicality analysis supports that buying spree might continue to push over the higher range zone provided no room is given to a formation of a trading candlestick that attempts to end with a top shadow index, most especially around the value line.
On the downside of the technical analysis, the BTC/USD market bears are to remain retarding around the resistance values of over $30,000 to get back their presence. In addition to that sentiment, sellers should look for several active rejection signals before launching an order under the principle of proper money management.
BTC/USD 4-hour Chart
The BTC/USD medium-term chart reveals the crypto market has exploded, breaking range resistances at the far trading zone over the trend lines of the SMAs.
The 14-day SMA indicator has crossed the 50-day SMA indicator from $26,799.82 to $27,619.00. The Stochastic Oscillators have traversed northbound into the overbought region, maintaining the maximal levels of 100 each to signify an ideal warning of gaining further exorbitantly increasing points afterward. Therefore, sellers are to brace up their belts to regain their levels in the market in no time.
Note: Cryptosignals.org is not a financial advisor. Do your research before investing your funds in any financial asset or presented product or event. We are not responsible for your investing results.
You can purchase Lucky Block here. Buy LBLOCK