Chainlink Is Stuck at $7.54 as It Rallies to an Overbought Region
Estimated Reading Time: 3 minutes
Don’t invest unless you’re prepared to lose all the money you invest. This is a high-risk investment and you are unlikely to be protected if something goes wrong. Take 2 minutes to learn more

Free Crypto Signals Channel
Chainlink (LINK) Long-Term Analysis: Bearish
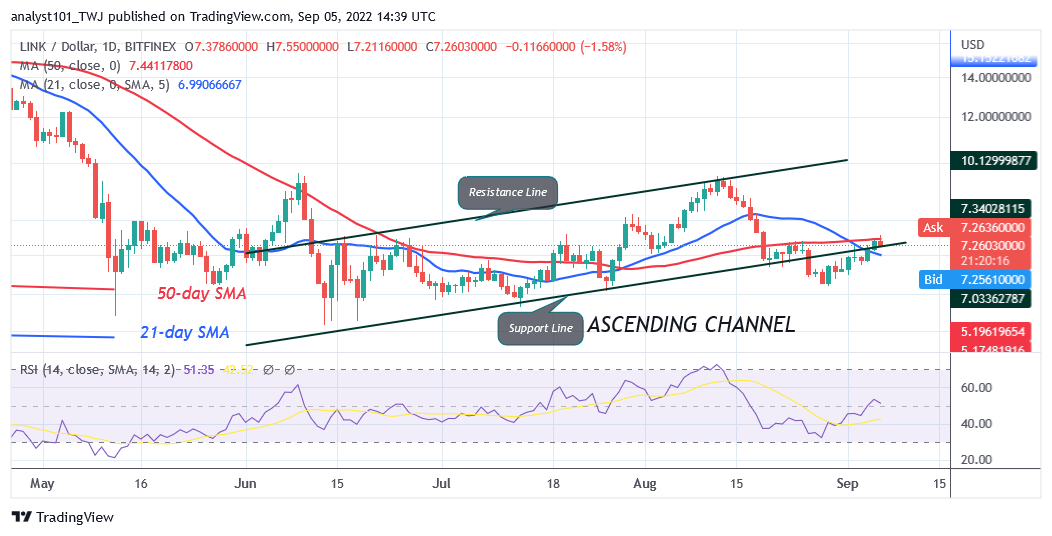
Chainlink (LINK) price is in a downtrend but makes an upward correction as it rallies to an overbought region. Buyers broke above the moving average lines but fail to break the 50-day line SMA. Chainlink is confined between the moving average lines. On the upside, if buyers keep the price above the 50- day line moving average, the altcoin will rise to the $9.50 overhead resistance. Conversely, Chainlink will decline to the previous low at $6.20 if the 21-day line moving average is breached. Nonetheless, if the bears break below the current support, the market will further decline to $5.70 or $5.40 price level. In the meantime, Chainlink is trading at $7.27 at the time of writing.
Chainlink (LINK) Indicator Analysis
Chainlink is at level 51 of the Relative Strength Index for period 14. It indicates that there is a balance between supply and demand. The price bars are between the moving average lines indicating a range-bound move of the cryptocurrency. The altcoin is above the 80% range of the daily stochastic. It indicates that the coin has reached the overbought region and may decline.
Technical indicators:
Major Resistance Levels – $18.00, $20.00, $22.00
Major Support Levels – $8.00, $6.00, $4.00
What Is the Next Direction for Chainlink (LINK)?
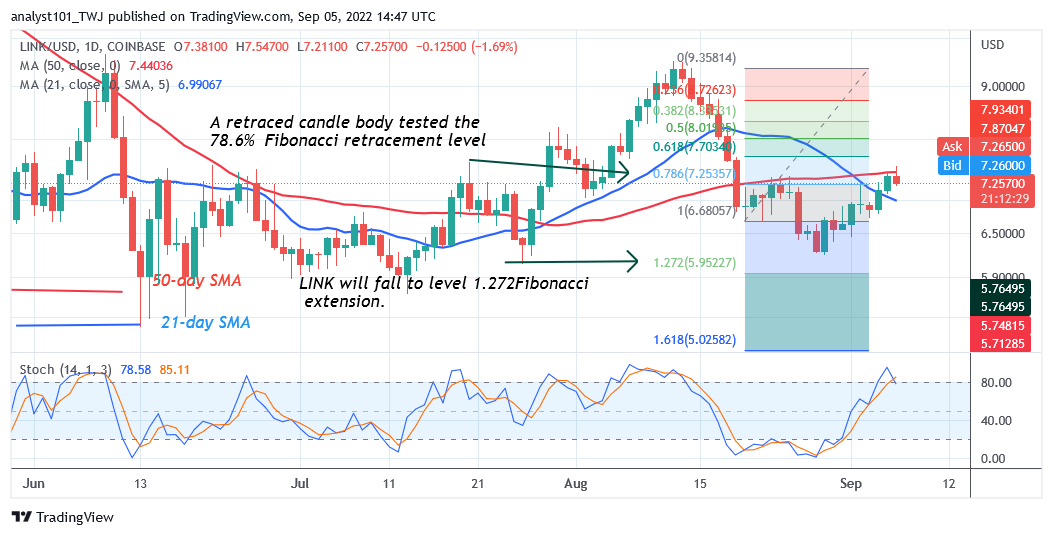
For the past week, Chainlink has been in an upward correction as it rallies to an overbought region. The coin is likely to decline as it reaches the overbought region. Meanwhile, on the August 20 downtrend, a retraced candle body tested the 78.6% Fibonacci retracement level. The retracement suggests that LINK will fall but reverse at level 1.272 Fibonacci extension or level $5.95. The altcoin has already reversed as it resumed upward correction.
You can purchase crypto coins here. Buy LBLOCK
Note: Cryptosignals.org is not a financial advisor. Do your research before investing your funds in any financial asset or presented product or event. We are not responsible for your investing results