Chiliz (CHZUSDZ) Buyers Oppose Bearish Flow
Estimated Reading Time: 2 minutes
Don’t invest unless you’re prepared to lose all the money you invest. This is a high-risk investment and you are unlikely to be protected if something goes wrong. Take 2 minutes to learn more

Price Analysis – CHZUSD Continue to Push Higher
Chiliz buyers are actively opposing the bearish flow, demonstrating resilience as they hold back sellers attempting to breach the $0.03500 key level. Throughout last month, the market has been entrenched in a bearish cycle, with sellers dominating after buyers lost momentum at the $0.05500 key zone. This marked a significant turnaround from the bullish strength that had previously been pushing the market higher.
Chiliz Key Levels
Support Levels: $0.03500, $0.03400
Resistance Levels: $0.03900, $0.04000
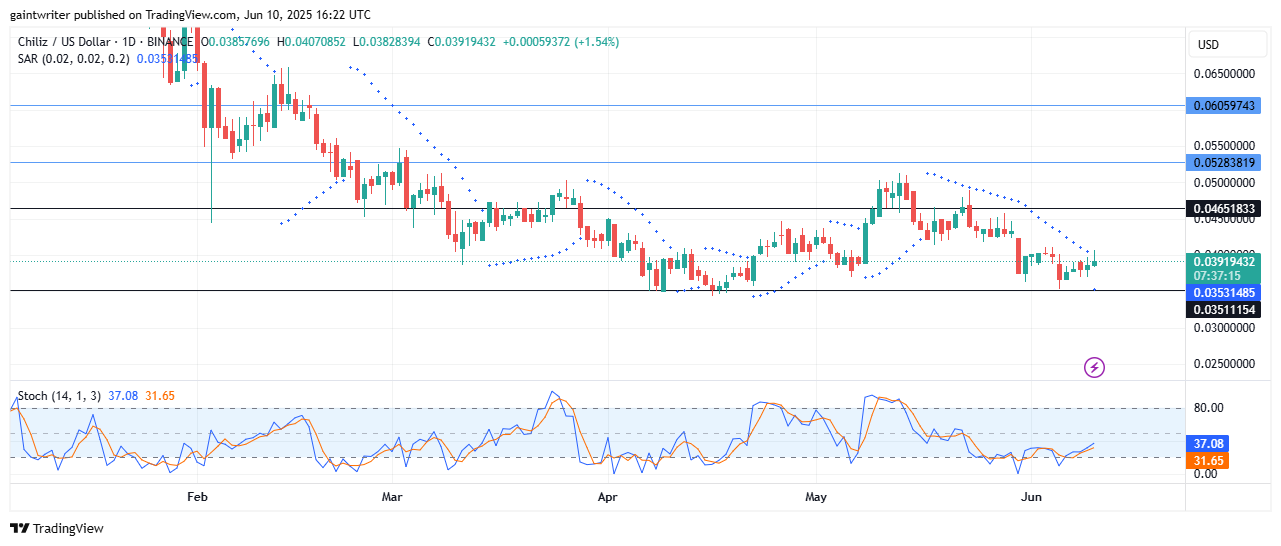 Since the drop from the $0.05500 market zone, a systematic decline has taken place, with each successive low prompting buyers to raise their strength at critical points. Following the bearish dump to the $0.03530 key level, buyers have managed to pull up to the $0.03900 key zone, aiming to regain some lost ground.
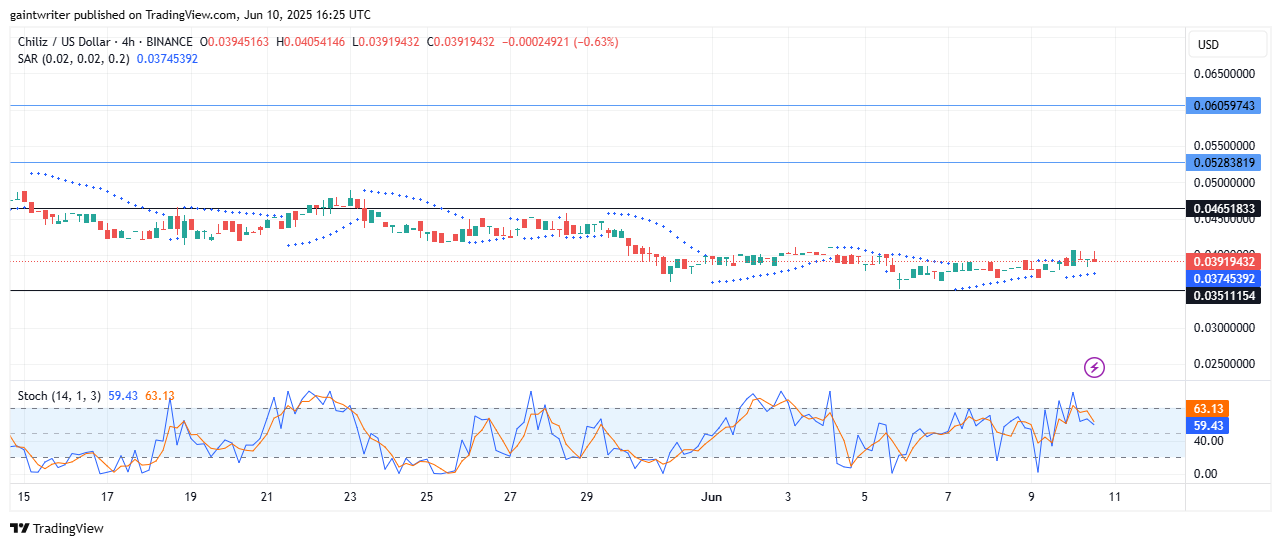
The Stochastic Oscillator indicates a bullish rise, suggesting that buyers are beginning to gain traction. However, the Parabolic SAR (Stop and Reverse) indicator still reflects bearish strength, signaling that sellers remain active in the market.
The long-term outlook for Chiliz suggests that maintaining support at the $0.03500 level is crucial for any potential bullish recovery. A successful hold above this level could provide a foundation for buyers to push towards the $0.03900 resistance. Conversely, if sellers manage to breach this support, it could lead to further declines, potentially targeting the $0.03400 level.
Market Expectation
In the short term, traders should closely monitor the price action around the $0.03900 resistance level. If buyers can build sufficient momentum to push above this resistance, it may signal the beginning of a bullish phase. The Stochastic Oscillator will be key in assessing buyer strength and potential breakout opportunities.
You can purchase Lucky Block here. Buy LBLOCK
Note: Cryptosignals.org is not a financial advisor. Do your research before investing your funds in any financial asset or presented product or event. We are not responsible for your investing results