Compound (COMPUSD) Fails to Break Out of Consolidation Confinement
Estimated Reading Time: 2 minutes
Don’t invest unless you’re prepared to lose all the money you invest. This is a high-risk investment and you are unlikely to be protected if something goes wrong. Take 2 minutes to learn more
Compound Analysis – Price Fails to Move Out of Consolidation
Compound fails to break out of consolidation confinement after being rejected at the $380 border. On the 20th of September, the coin fails dropped from the $380 significant level. And from there, Compound has neither been able to break back above the $380 level nor drill below the $270 significant level acting as a lower border. Therefore, Compound continues in consolidation after crashing into $270.
Compound Significant Levels
Resistance Levels: $530, $380
Support Levels: $270, $180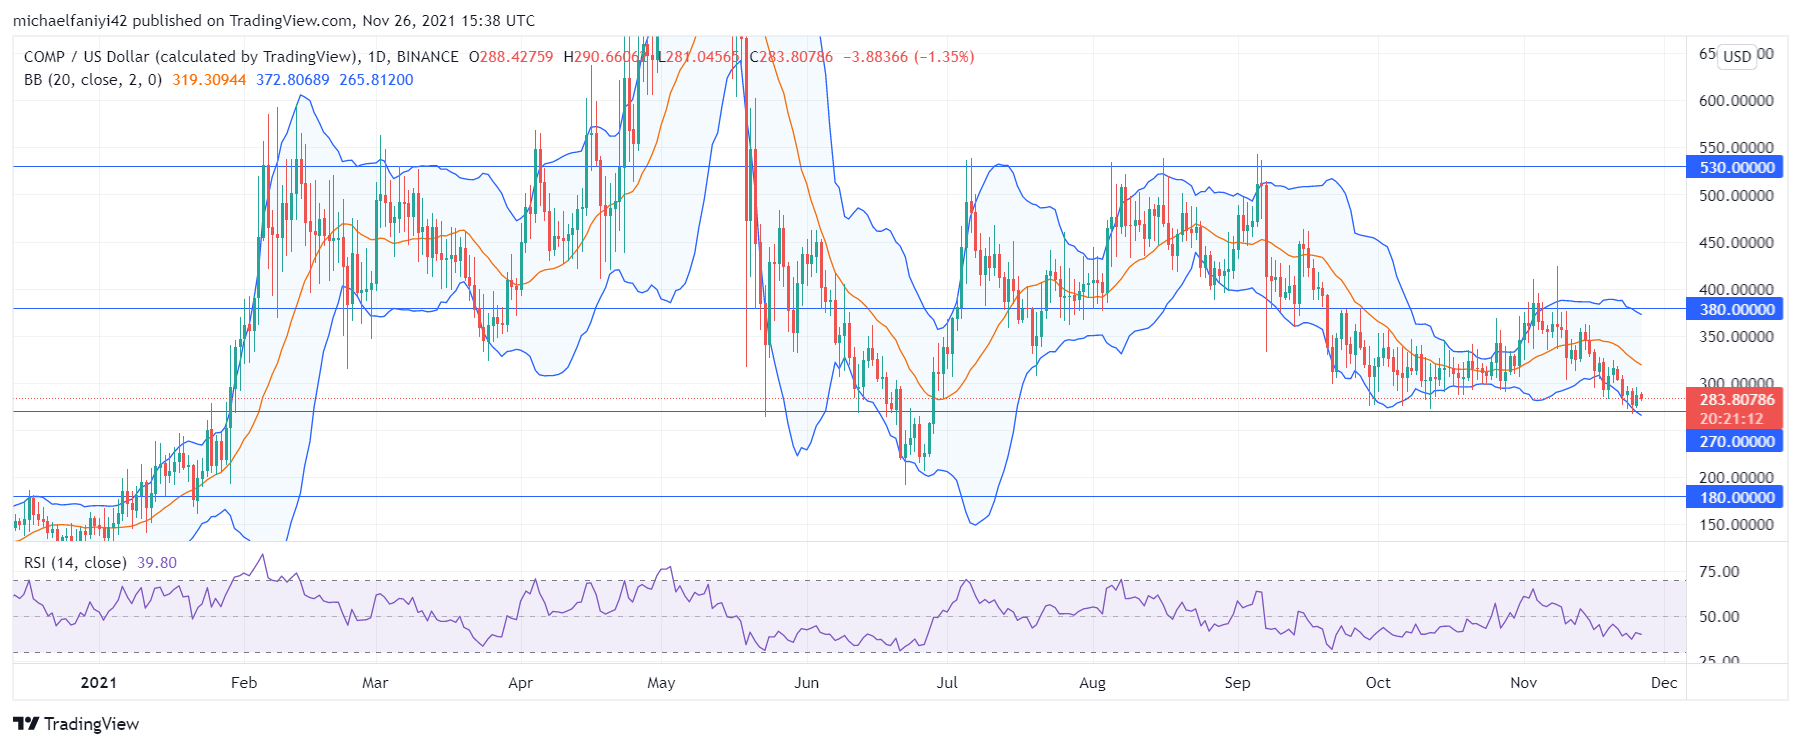
The market has suffered a similar consolidation fate recently when price rose by 170% to the $530 key level from the 26th of June. Following that, price was limited to a range of movement in which the coin cranked continuously between the $530 resistance level and the $380 support level. This lasted for up to two and a half months, till the price dropped below $380.
Since dropping below $380, the coin has largely been moving through a silent market. This can be seen as the Bollinger Band squeezes around the market till the beginning of November. On the 1st of November, price made the first concerted effort since September to break upward of the consolidation, but Compound fails woefully. Now, price has fallen through the middle band and crashed to $270. The RSI (Relative Strength Index) plunging signal line suggests the market is predisposed to falling further.

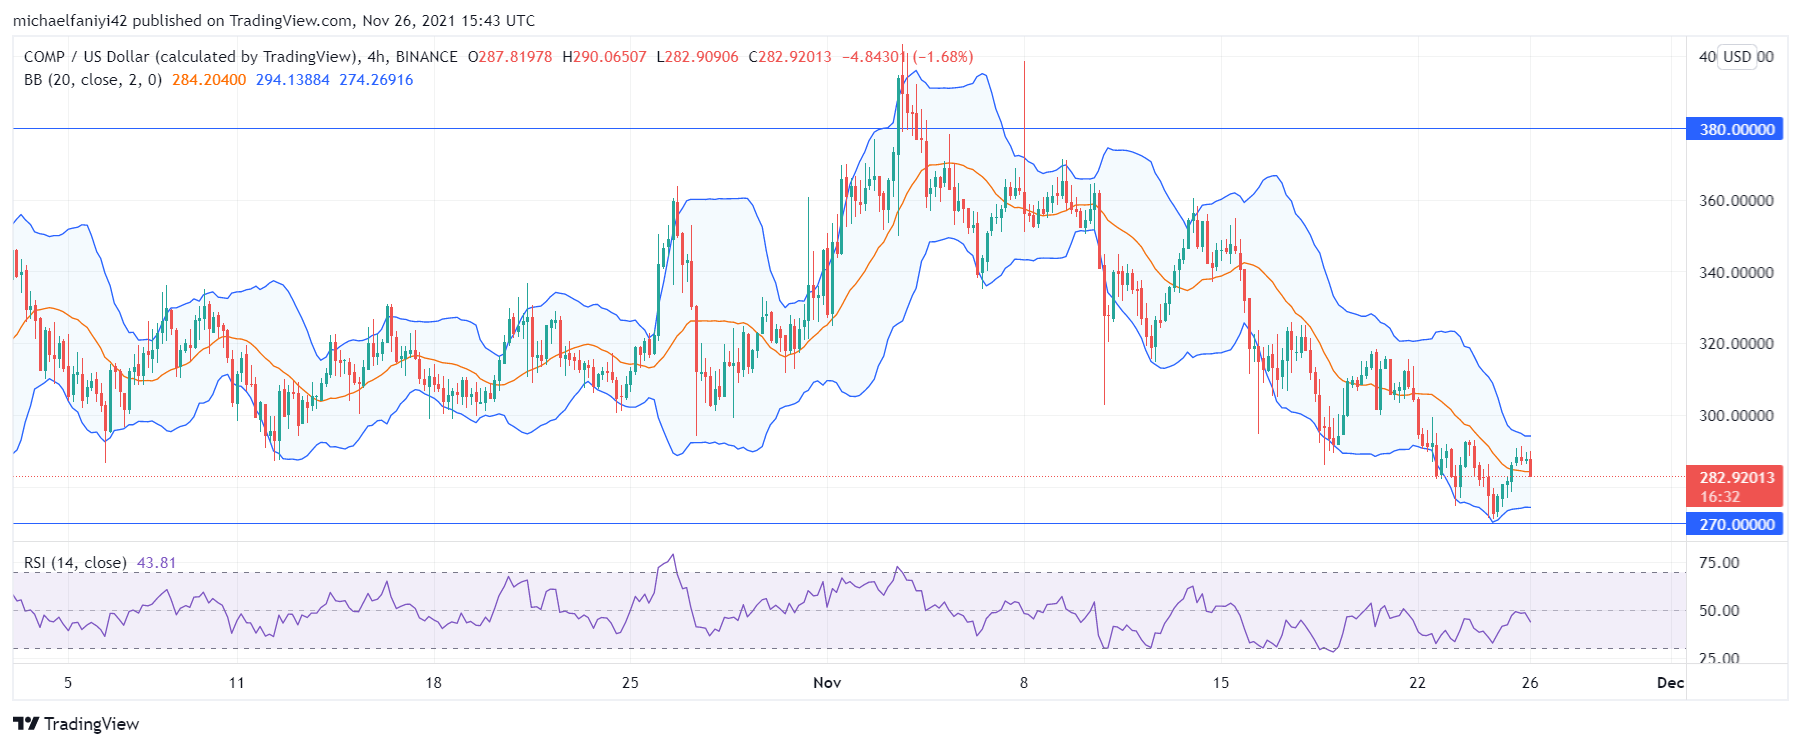
Market Expectations
On the 4-hour chart, the price is now recovering from the $270 key level to continue its ranging movement. The 4-hour candles have risen above the middle line of the Bollinger Band to aid its uptrend. The RSI (Relative Strength Index) indicator shows that price has been ranging, albeit in bearish territory. This also suggests that when the coin eventually breaks out, it is likely to break lower.
You can purchase crypto coins here: Buy Tokens
Note: Cryptosignals.org is not a financial advisor. Do your research before investing your funds in any financial asset or presented product or event. We are not responsible for your investing results.