DeFi Coin Price Prediction: DEFC/USD Becomes Cheap for More Buyers to Surface
Estimated Reading Time: 2 minutes
Don’t invest unless you’re prepared to lose all the money you invest. This is a high-risk investment and you are unlikely to be protected if something goes wrong. Take 2 minutes to learn more


Free Crypto Signals Channel
DeFi Coin Price Prediction – August 17
The DeFi Coin price prediction would begin to form higher as the coin prepares to follow the bullish movement.
DEFC/USD Medium-term Trend: Bullish (4H Chart)
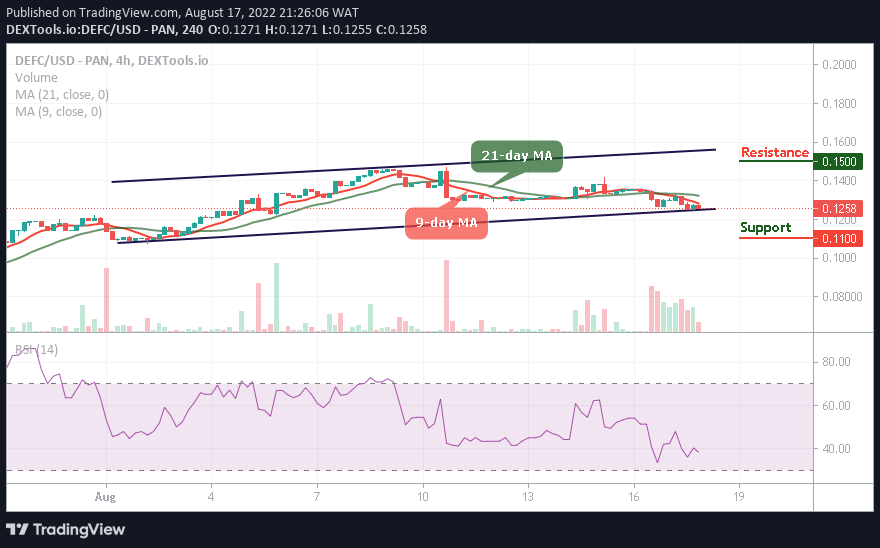
Key Levels:
Resistance levels: $0.16, $0.18, $0.20
Support levels: $0.10, $0.08, $0.06
DEFC/USD is at the time of writing trading below the 9-day and 21-day moving averages. The market price is hovering at $0.125 and the DeFi Coin price may retreat more to allow new investors to come into focus.
DeFi Coin Price Prediction: DEFC/USD Retreats to Break Upside
The DeFi Coin price would begin to rise and break above the 9-day and 21-day moving averages as the bulls defend the $0.12 support level. However, any bullish movement towards the upper boundary of the channel will push the coin to the potential resistance levels of $0.16, $0.18, and $0.20.
Moreover, this may not play out if the bears break below the lower boundary of the channel and fall to the support levels of $0.10, $0.08, and $0.06. Moreover, the technical indicator Relative Strength Index (14) is likely to cross below the 40-level to prepare many new buyers to come into the market.
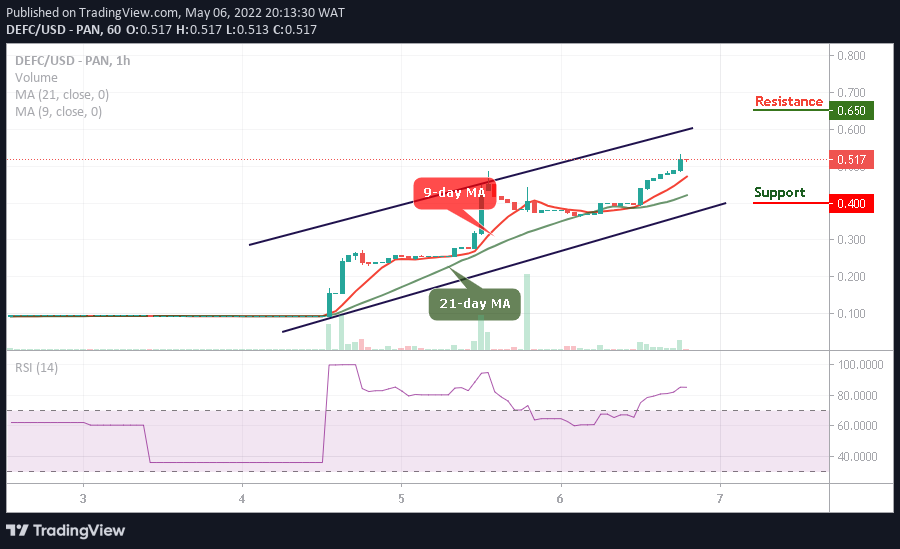
DEFC/USD Medium-term Trend: Ranging (4H Chart)
When compared to the 4-hour chart, the DeFi Coin price would move up higher as it prepares to cross above the 9-day and 21-day moving averages. However, the long-term moving averages may begin the bullish movement as the market prepares for a new trend.
Nevertheless, if the buyers push the price above the moving averages, higher resistance could be found at $0.15 and above as the technical indicator Relative Strength Index (14) moves around the 40-level. Moreover, should the bulls fail to move the current market value above, the bears may step into the market, and the nearest support level could be located at $0.11 and below.
You can purchase DeFi Coin here. Buy DEFC