DeFi Coin Price Prediction: DEFC/USD Bulls Will Surface after Moving Sideways
Don’t invest unless you’re prepared to lose all the money you invest. This is a high-risk investment and you are unlikely to be protected if something goes wrong. Take 2 minutes to learn more

Free Crypto Signals Channel
The DeFi Coin price prediction is going to face moderate volatility and gain long-term before heading to the upside.
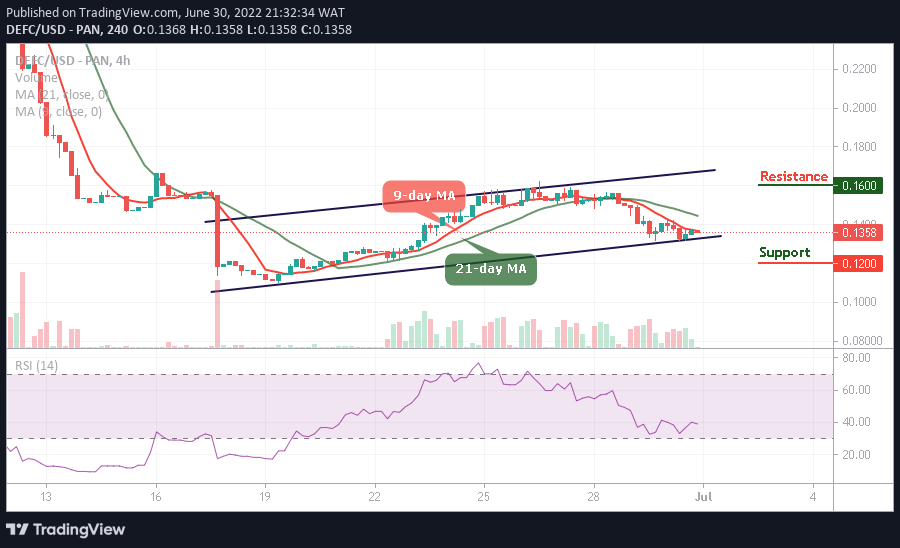
DEFC/USD Long-term Trend: Ranging (4H Chart)
Key Levels:
Resistance levels: $0.16, $0.17, $0.18
Support levels: $0.12, $0.11, $0.10
DEFC/USD is trading around the $0.135 level below the 9-day and 21-day moving averages. In the range of the descending channel, the closest support could be located at $0.130 below the lower boundary of the channel. Meanwhile, if the market increases, additional resistance can be found above the 9-day and 21-day moving averages.
DeFi Coin Price Prediction: DEFC Price May Continue to Move Sideways
The DEFC price may likely create additional bullish trends once the sideways movement fades away, and this is noticeable for the technical indicator Relative Strength Index (14) as the signal line moves around the 40-level.
At the time of writing, the DeFi Coin will cross above the moving averages, but any bearish movement below the lower boundary of the channel may bring the coin to another serious downtrend. However, the support levels for DEFC/USD can be located at $0.12, $0.11, and $0.10, while the resistance levels would be found at $0.16, $0.17, and $0.18 respectively.
DEFC/USD Medium-term Trend: Ranging (2H Chart)
The DeFi Coin continues to hover within the 9-day and 21-day moving averages. However, the nearest resistance is set above the resistance level of $0.14 because the market price is still changing at around $0.135.
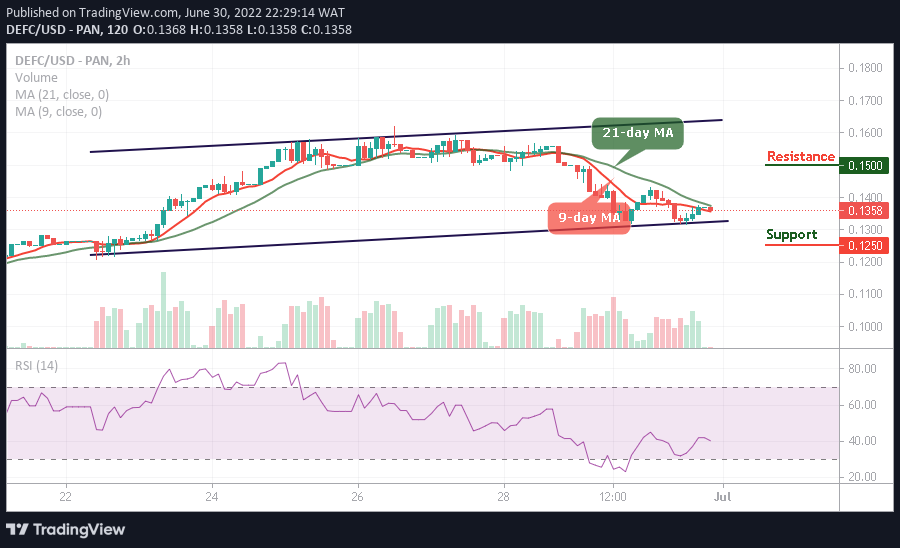
However, if the DEFC price crosses below the lower boundary of the channel, DEFC/USD may create a new low at the support level of $0.125 and below. Meanwhile, any bullish movement to the upside will allow the market to form a new upward trend, and this could hit the potential resistance level at $0.150 and above.
You can purchase DeFi Coin here. Buy DEFC