Dogecoin (DOGE/USD) Price Falls, Following a Spike Close to $0.11
Estimated Reading Time: 3 minutes
Don’t invest unless you’re prepared to lose all the money you invest. This is a high-risk investment and you are unlikely to be protected if something goes wrong. Take 2 minutes to learn more

Dogecoin Price Prediction – December 12
The Dogecoin market activity presently falls against the purchasing weight of the US Dollar, following a spike close to the resistance of $0.11 during yesterday’s session.
Pressures in the market have been gradually but surely seen to be paving the way for an upward trend and caving in to a necessary circumstance for a corrective moment. Before bulls often push back for a recovering phase of higher increases, price activities may begin to resettle at lower zones beneath the middle Bollinger Band trend line.
DOGE/USD Market
Key Levels:
Resistance levels: $0.1050, $0.1150, $0.1250
Support levels: $0.080, $0.075, $0.070
DOGE/USD – Daily Chart
The DOGE/USD daily showcases that the crypto market falls, following a spike close to the resistance line of $0.11.
The positional values of the Bollinger band indicators from the topside to the downside are portending that the crypto economy is still within bullish trends, having positioned from $0.070 to around a higher point of $0.11. The stochastic oscillators are in a southbound-crossing mode toward the line of 40.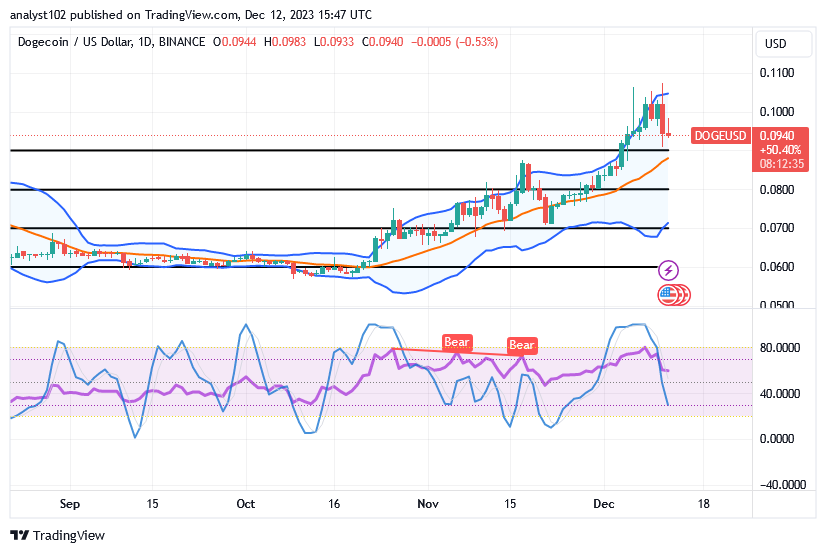
Is the DOGE/USD market trading at or near $0.0940, having finished its corrections?
It would be a good technical idea to go by the reading of the stochastic oscillators to detect the pace of velocity to the downside before observing a re-buying process order, given that the DOGE/USD trade falls following a spike close to the resistance of $0.11.
Bears are probably going to keep the cryptocurrency company operation below the $0.11 resistance line for a while because there has been a line of depressing pressures following varying degrees of rejections below it. In the long run, the force could result in setting the price to rebuild the base at $0.080 or slightly less if that scenario needs to get more intense.
Whatever the case, as the trend toward the moon is strengthening, there will likely be more favorable upswing movements over the most recent average higher resistance line of $0.11. Consequently, investors can be confident that they will profit more by applying the virtues of patience in their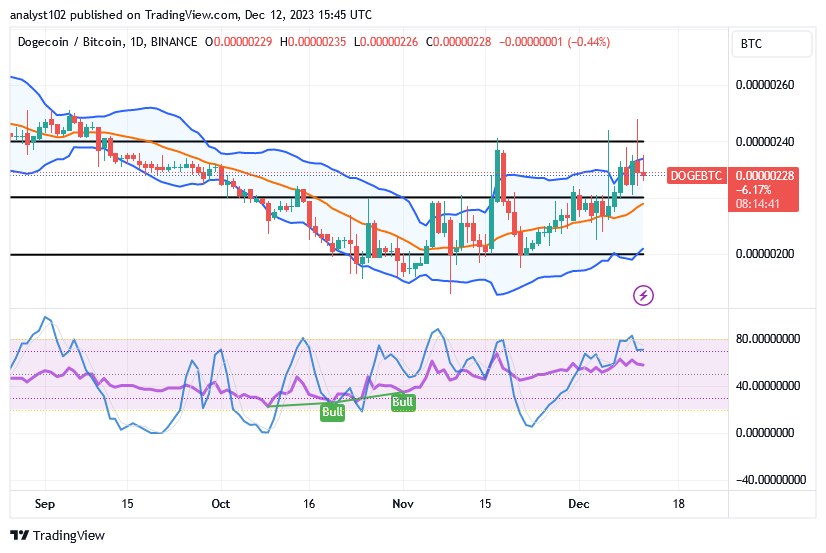
DOGE/BTC Price Analysis
In contrast, the Dogecoin market falls slightly against the worth of Bitcoin, following a spike that is made against a higher resistance line drawn above the upper Bollinger Band.
Buying pressure is anticipated based on the positional images of the indicators. Divergences against more consistent increases along the upper Bollinger Band’s point do not seem to be developing anytime soon, suggesting that the base cryptocurrency may see a delay in its rate of appreciation. The blue line has remained around the 80 line as the stochastic oscillators have made an effort to advance north. Investors ought not to sell their holdings.
Note: Cryptosignals.org is not a financial advisor. Do your research before investing your funds in any financial asset or presented product or event. We are not responsible for your investing results.
You can purchase Lucky Block here. Buy LBLOCK