Dogecoin (DOGE/USD) Trade Fluctuates, Holding Below $0.065
Don’t invest unless you’re prepared to lose all the money you invest. This is a high-risk investment and you are unlikely to be protected if something goes wrong. Take 2 minutes to learn more

Dogecoin Price Prediction – September 18
A long-moving in ranges has over time been prevailing around visible points, given that the DOGE/USD trade fluctuates near above the line of $0.060, holding below the value line of $0.065.
The fact that gravitational forces are moving pretty quickly to the north suggests that it may be difficult to advance past some overhead resistances that are located between $0.065 and $0.070. Bulls may nonetheless push in a rallying mode by reaching a higher line in an averaging style to $0.075, if bears lose the positions toward posing a rejection against those value lines.
DOGE/USD Market
Key Levels:
Resistance levels: $0.070, $0.075, $0.080
Support levels: $0.055, $0.050, $0.045
DOGE/USD – Daily Chart
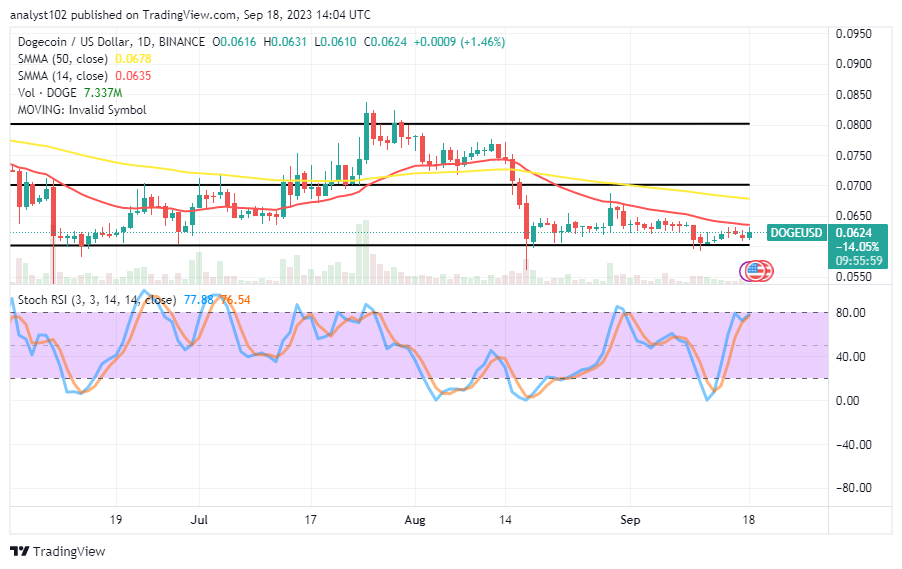
The DOGE/USD daily reveals the crypto-economic trade fluctuates, holding below the point of $0.065 resistance.
The 14-day SMA indicator is underneath the 50-day SMA indicator, marking down the logical resistances that price is tending to encounter if furthering its rising force rate beyond its high point of $0.0631 in the near future. The stochastic oscillators are positioned tightly from 76.54 to 77.88 points.
Are there any remaining opportunities for the DOGE to appreciate in value relative to the US coin?
The probability of the DOGE/USD market bulls moving further through overhead resistances away from its current trade spot rated at 1.46% appears to weigh a low gravitational force as the crypto-economic trade fluctuates, holding below the $0.065.
To successfully intercept the larger counterpart to the north, a strong rising pressure would need to appear in its mode of motion above the trend line of the smaller moving average. It will be acknowledged that a confirmation has been staged in this way.
The current transaction line still shows that a lack of decision-making in trading may continue to coexist with potential price increases that the market may be considering breaking through. Bears should be ready to seize an active price action reversal that may manifest soon.
DOGE/BTC Price Analysis
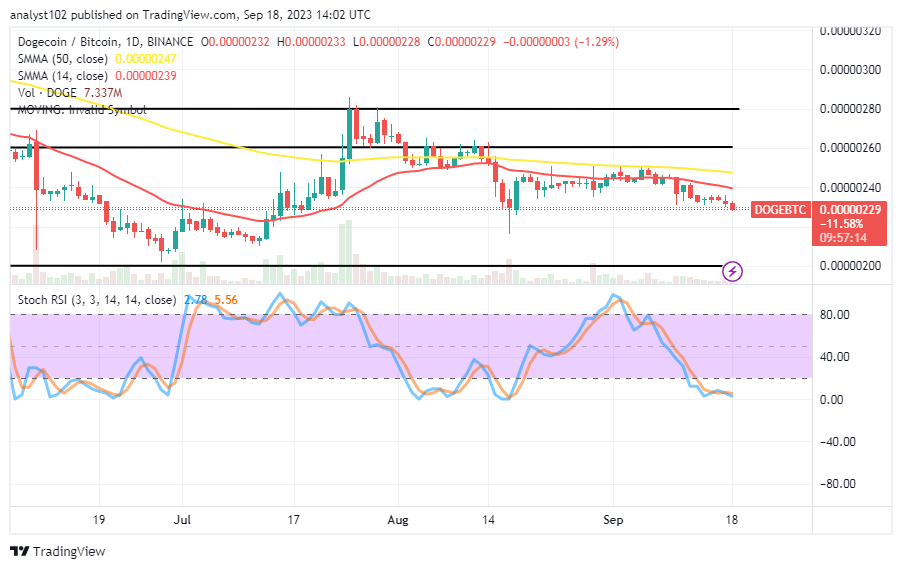
In contrast, the Dogecoin market fluctuates in a slow-and-steady moving motion to the downside against Bitcoin, holding below the trend lines of the moving averages.
The 14-day SMA indicator has been slowly stretching southward underneath the 50-day SMA indicator. The Stochastic Oscillators have traversed into the oversold region. The base cryptocurrency indicates that it is pushing against the counter-trading cryptocurrency in search of support because there has been a bearish trading candlestick. Therefore, sellers should be cautious of any rebound or reversal in the direction of the downward movements..
Note: Cryptosignals.org is not a financial advisor. Do your research before investing your funds in any financial asset or presented product or event. We are not responsible for your investing results.
You can purchase Lucky Block here. Buy LBLOCK


