Enjin Coin (ENJUSD) Trades Below the $0.430000 Market Level
Estimated Reading Time: 3 minutes
Don’t invest unless you’re prepared to lose all the money you invest. This is a high-risk investment and you are unlikely to be protected if something goes wrong. Take 2 minutes to learn more
ENJUSD Analysis – Sellers Brace for a New Bearish Impact
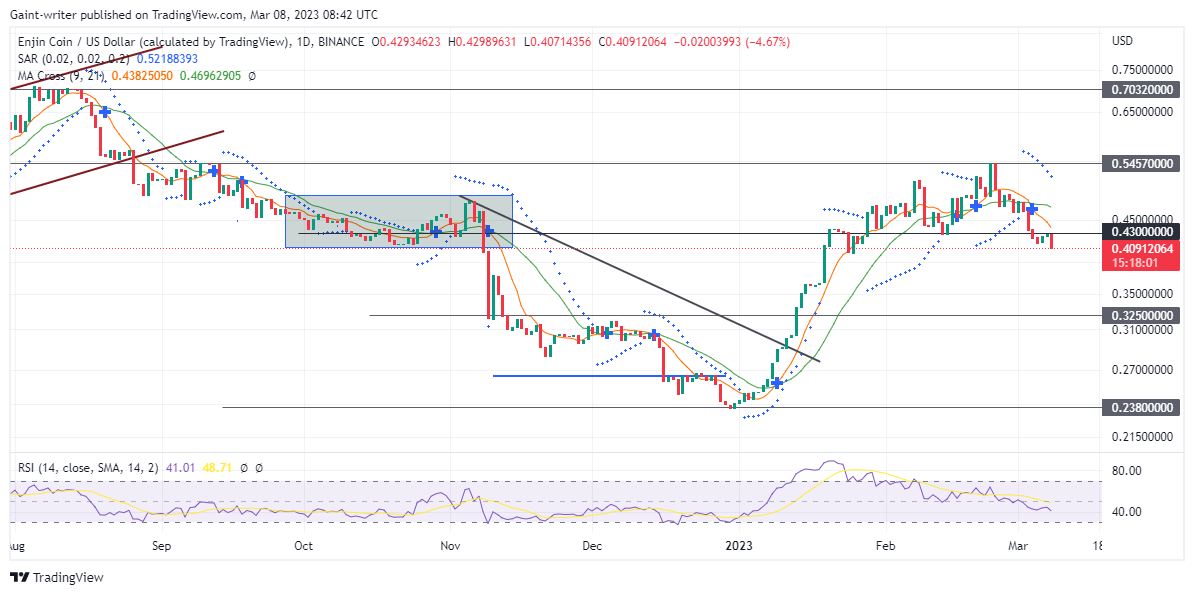
Enjin Coin trades below the $0.430000 market level amidst buyers’ pullback to the $0.430000 market level. The start of the new year came as a positive sign for the ENJUSD price. This was however against the previous bearish trend that was heavily showcased last year. The bulks were picked with great force, resulting in a price volume outflow. The bulls rallied up from the $0.238000 key zone as bullish momentum continued to play out in January.
ENJUSD Key Levels
Resistance Levels: $0.545700, $0.430000
Support Levels: $0.325000, $0.218000

The crypto price has recently begun to change trend, as we now see on the daily chart. The sellers have decided to intensify their breakthrough on the ENJUSD token. Rather than experience a successful breakout above the $0.545700 key zone, the sellers decided to change their price focus. The bulls couldn’t gather enough strength as the price consolidated between the key zones of $0.430000 and $0.545700. All through February, the crypto price has maintained its action between these key levels.
Now, the sellers are causing a drive below the $0.430000 key zone. This indicates a bearish trend in the market, as the sellers are trying to push the price lower. The buyers have recently caused a drive back following the breakout, but the sellers have been able to maintain their control. This, therefore, confirms a breakthrough in selling action in the market.
Market Expectation
The ENJUSD is more likely to remain bearish as several other indicators also confirm the selling trend. The Parabolic SAR (Stop and Reverse) indicator changed its trend to a bearish slope following a price breakout below the $0.430000 key zone. The Moving Average crossing is also confirmed by a cross-over for a bearish tendency. This shows that more bearish trading is likely to be experienced below the $0.430000 key zone. As a result, sellers may be able to drive the price moment to the key level of $0.325000.
You can purchase Lucky Block here. Buy LBLOCK
Note: Cryptosignals.org is not a financial advisor. Do your research before investing your funds in any financial asset or presented product or event. We are not responsible for your investing results.