Ethereum (ETH) Is Declines After Retesting The Resistance At Level $2,500
Estimated Reading Time: 2 minutes
Don’t invest unless you’re prepared to lose all the money you invest. This is a high-risk investment and you are unlikely to be protected if something goes wrong. Take 2 minutes to learn more

Ethereum Price Long-Term Analysis: Bullish
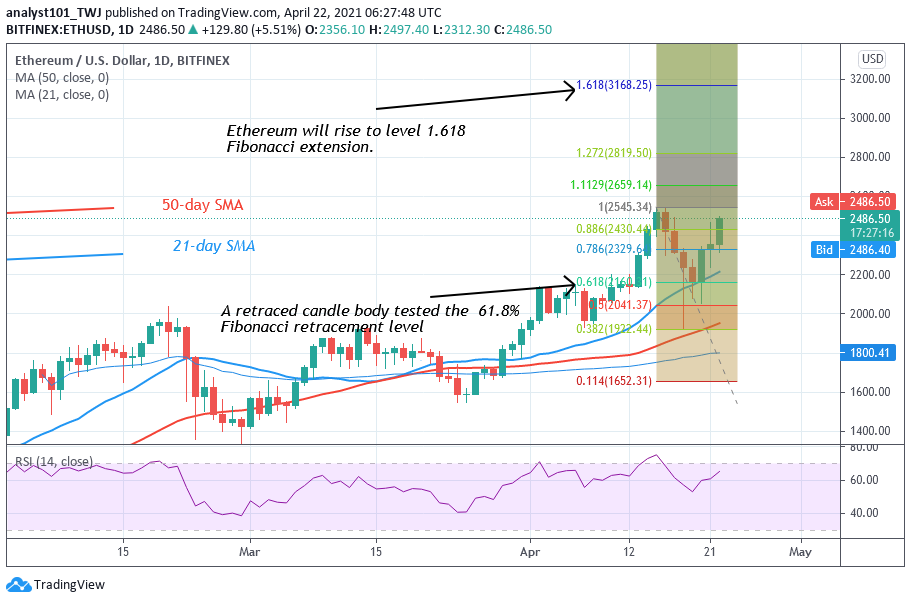
The uptrend has been interrupted since April 15 at the resistance of $2,544. The biggest altcoin fell to the low of $2,200. The bulls have bought the dips as the market resumed a fresh uptrend. A rally above $2,700 is expected if the bulls can overcome the resistance at $2,544. Meanwhile, on April 15 uptrend, a retraced candle body tested the 61.8% Fibonacci retracement level. The retracement indicates that Ethereum will rise to level 1.618 Fibonacci extension or the high of $3,168.25.
Ethereum Indicator Analysis
Ethereum has fallen to level 63 of the Relative Strength Index period 14. It implies that the market is above the centerline 50 and capable of rising on the upside. The altcoin is above the 80% range of the daily stochastic. It also implies that the coin is trading in the overbought region of the market. The crypto will fall if the bulls fail to overcome the recent high.
Technical indicators:
Major Resistance Levels – $2, 600, $2,800, $3,000
Major Support Levels – $1.500, $1, 300, $1,100
What Is the Next Direction for Ethereum?
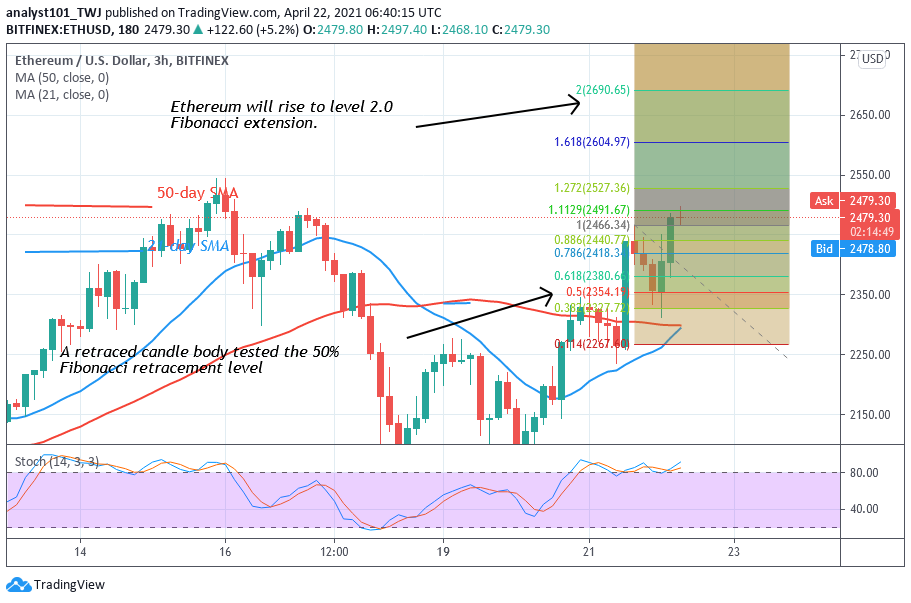
On 4- hour chart, the coin is making an upward move but trading below the $2544. In the meantime, it is facing resistance at $2,500. On April 21 uptrend, the retraced candle body tested the 50% Fibonacci retracement level. The retracement indicates that the market will rise to level 1.618 Fibonacci extension or the high of $2,690.65.
Note: cryptosignals.org is not a financial advisor. Do your research before investing your funds in any financial asset or presented product or event. We are not responsible for your investing results