Ethereum (ETH/USD) Breaks Down at Lower Range-line
Estimated Reading Time: 3 minutes
Don’t invest unless you’re prepared to lose all the money you invest. This is a high-risk investment and you are unlikely to be protected if something goes wrong. Take 2 minutes to learn more
Ethereum Price Prediction – July 19
It is now on the financial book of ETH/USD that the crypto economy breaks down at the lower range-line at a negative percentage rate of 4.07. The crypto market’s worth stands at around $1,820.
ETH/USD Market
Key Levels:
Resistance levels: $2,000, $2,500, $3,000
Support levels: $1,600, $1,500, $1,400
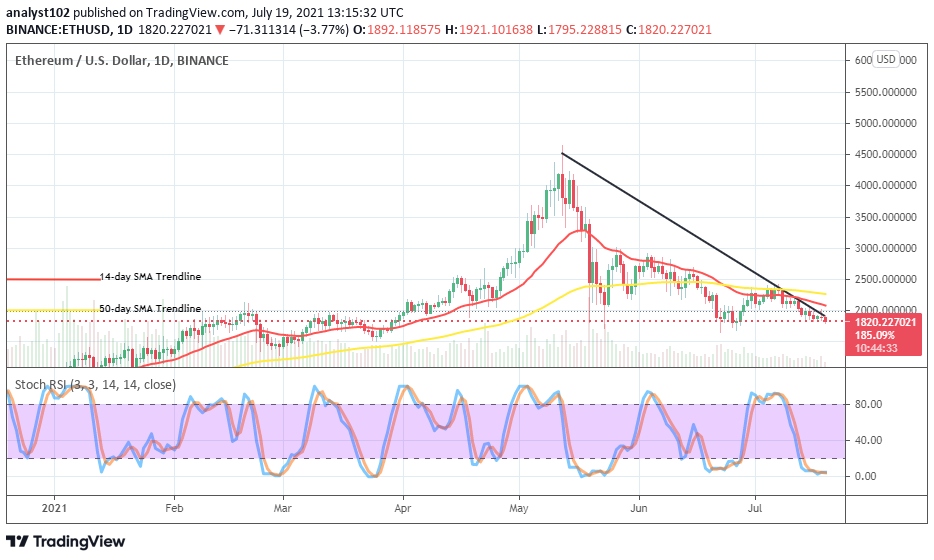
ETH/USD – Daily Chart
On the ETH/USD daily chart, the crypto’s valuation now breaks down at the lower range-line of $2,000. The bearish trend-line drew downward across the trend lines of SMAs. The 50-day SMA indicator is above the 14-day SMA indicator. The Stochastic Oscillators are in the oversold region with conjoined lines in it, suggesting a consolidation moving manner. That signals that the breaking down may stay for a while in the crypto situation.
As the ETH/USD market breaks down at the lower range line, will there be a continuation to the downside?
There could be a continuation to the downside for a while as the ETH/USD market breaks down at the lower range line at $2,000. The positioning of SMA trend lines above the current trading point on the chart indicates that the crypto valuation is under pressure. However, it appears that the market is looking for supports below those trend lines to allow bulls to locate their stands.
Talking about the bearish trend continuation, the ETH/USD bears would have to buckle up in their efforts to push the market down to around the level of $1,500. If the market holds stronger in a consolidation moving style below the level of $2,000, it means that another lower range-bound zones will surface. All in all, traders considering going for short positions should be wary of their stands.
ETH/BTC Price Analysis
The ETH/BTC price analysis chart shows that the base crypto trades in a range with the counter crypto. From the technical point of viewing, ETH may soon regain its lost trending capability against BTC. The 14-day SMA trend-line is located closely above the 50-day SMA trend-line as the bullish trend-line drew close to support the bigger SMA. The Stochastic Oscillators are in the oversold region with the lines conjoined, tightly pointing southbound. That indicates that the base trading tool may have to take its time before swinging against the counter crypto’s trending capability.
Note: Cryptosignals.org is not a financial advisor. Do your research before investing your funds in any financial asset or presented product or event. We are not responsible for your investing results.
You can purchase crypto coins here. Buy Tokens