Tamadoge (TAMA/USD): Navigating Opportunities in a Consolidation Phase for Potential Future Gains
Estimated Reading Time: 3 minutes
Don’t invest unless you’re prepared to lose all the money you invest. This is a high-risk investment and you are unlikely to be protected if something goes wrong. Take 2 minutes to learn more
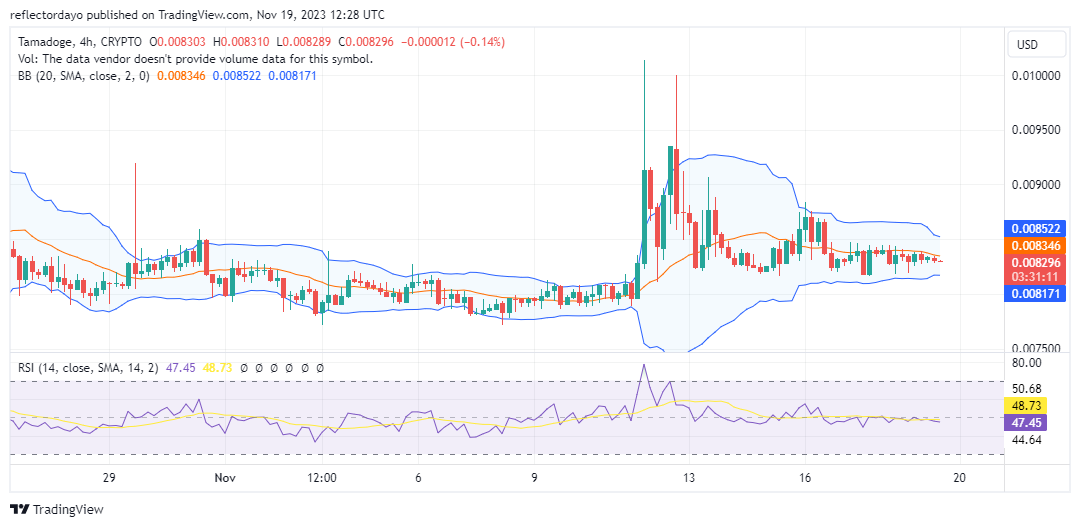
As of November, Tamadoge (TAMA/USD) has undergone a dynamic market phase characterized by a notable bullish surge, followed by a consolidation around the $0.0083 price level. The market exhibited a strong bullish trend starting on November 10 and 11, driving prices aggressively upward from $0.0079 to $0.010. This rapid ascent led to a significant divergence in the Bollinger Bands, resulting in a robust bandwidth indicative of increased volatility.
Key Levels
- Resistance: $0.013, $0.014, and $0.015.
- Support: $0.0075, $0.0073, and $0.007.
TAMA/USD Price Analysis: The Indicators’ Point of View
Following the initial TAMA/USD price surge, the $0.010 price level was tested again on November 12. Subsequently, over the remaining part of the month, the price action transitioned into a more subdued phase, forming a price channel with a narrowed range centered around $0.0083.
In terms of the Relative Strength Index (RSI), the RSI line is currently tracking along the 50 level of the Bollinger Bands indicator. This positioning suggests a neutral stance in terms of market strength, indicating a balance between buying and selling pressure. Traders may anticipate potential price movements by monitoring how the RSI behaves relative to this mid-level, as a move above 50 could suggest strengthening bullish momentum, while a move below 50 may indicate increased bearish pressure.
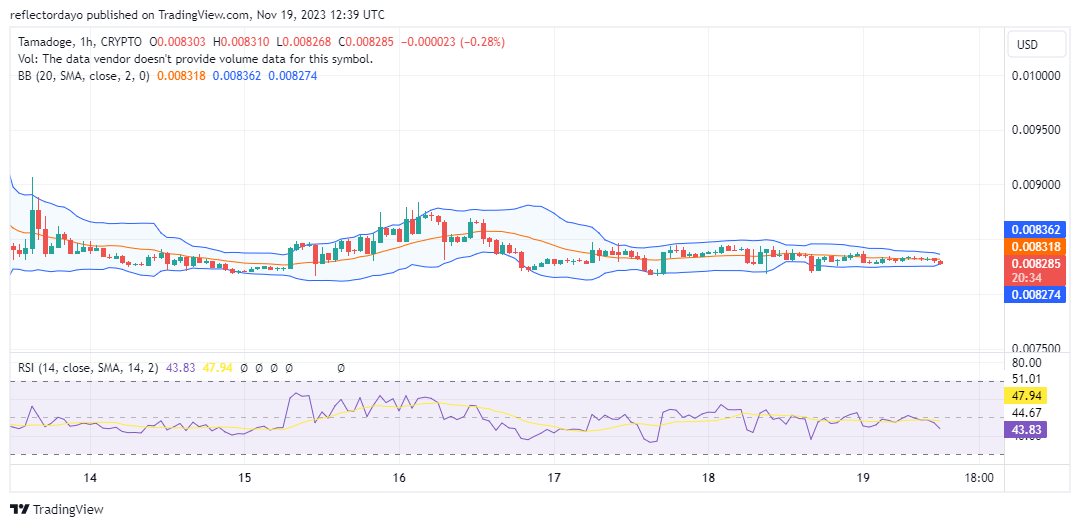
Tamadoge Short-Term Outlook: 1-Hour Chart
As the Bollinger Bands on the 4-hour chart indicate a decline in the level of volatility, this is further confirmed on a 1-hour chart, helping to illustrate the market as being within a defined price range. TAMA/USD Traders should closely watch for a breakout or breakdown from this price channel, as it could signal the resumption of a trend or the emergence of a new directional bias in the Tamadoge market.
Mark November 30th of this year as TAMA BBQ time, as they finish burning through the next burn of 12,500,000 $TAMA!
🔥 Clear your calendar, it’s TAMA BBQ time on November 30th as we complete our next burn of 12,500,000 $TAMA!
Check out the details on the Burn Portal 👉 https://t.co/CweV78geeJ pic.twitter.com/QVZ8jZgUhm
— TAMADOGE (@Tamadogecoin) November 19, 2023
Do you want a coin that will be 100 times more valuable in the next few months? That is Tamadoge. Buy TAMA today!