Ethereum (ETH/USD) Market Appears, Forming a Bullish Flag Pattern
Estimated Reading Time: 3 minutes
Don’t invest unless you’re prepared to lose all the money you invest. This is a high-risk investment and you are unlikely to be protected if something goes wrong. Take 2 minutes to learn more

Free Crypto Signals Channel
Ethereum Price Prediction – April 18
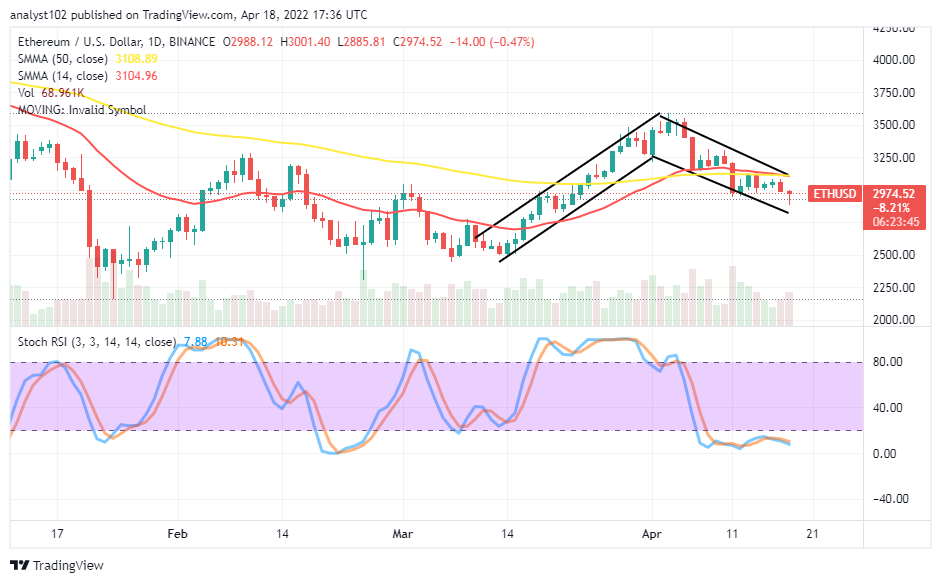
Going by a closer technical angle of viewing, the current trading situation pictures the ETH/USD market appears, forming a bullish flag pattern as price trades between the high and low of $3,001 and $2,885. There is a recording of a minimal negative percentage of 0.47.
ETH/USD Market
Key Levels:
Resistance levels: $3,250, $3,500, $3,750
Support levels: $2,750, $2,500, $2,250
ETH/USD – Daily Chart
The ETH/USD daily chart showcases the crypto-economic market appears, forming a bullish flag pattern. Price remains, swinging back upward from beneath the psychological trading level at $3,000. A critical support baseline is around the $2,750 level. The 14-day SMA indicator remains conjoined with the 59-day SMA indicator closely over the value-line mentioned earlier in this paragraph. The Stochastic Oscillators are moving in a consolidation format to denote the market is yet to find conducive support.
What should be the general expectation of traders by now as the crypto market appears, forming a bullish flag trading pattern?
Traders needed to be optimistic about bracing up for getting a buy order as the ETH/USD market appears, forming a bullish flag pattern. Over a couple of sessions, the crypto economy hovered around the $3,000 after corrections in its valuation lately. The consolidation moving mode of the stochastic oscillators in the oversold region over time has wiped off the probability of getting to see reliable free-falls beyond the $2,750 support level in the near time.
On the downside of the technical analysis, the ETH/USD market short-position placers may not have a smoother period, getting a decent entry point for a new sell order around the $3,000 level. Except if the market has to encounter a rejection closely around the conjoining spot of the SMAs afterward. However, a breakout of the area will summarily lead to an invalidation process of the assumption.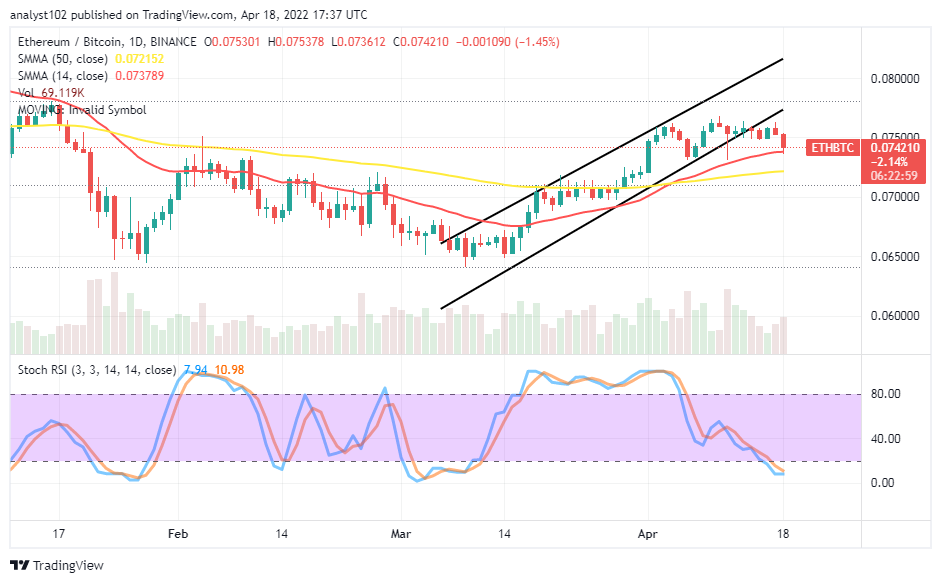
ETH/BTC Price Analysis
In comparison, Ethereum possesses a stronger-trading stance at a higher resistance zone against Bitcoin. The reason for that been that several variant candlesticks been formed. A bearish candlestick is in the making toward the smaller SMA trend line from the buying signal side. The 14-day SMA is above the 50-day SMA. The Stochastic Oscillators have dipped into oversold region, trying to make an effort to close their lines within. From the look of things, a breakdown at the smaller trading indicator will attest to seeing the base crypto losing its trending capacity to the chief counter-trading crypto for a while
Note: Cryptosignals.org is not a financial advisor. Do your research before investing your funds in any financial asset or presented product or event. We are not responsible for your investing results.
You can purchase Lucky Block here. Buy LBlock: