Ethereum (ETH/USD) Market Breaches Northward at $4,000
Estimated Reading Time: 3 minutes
Don’t invest unless you’re prepared to lose all the money you invest. This is a high-risk investment and you are unlikely to be protected if something goes wrong. Take 2 minutes to learn more
Ethereum Price Prediction – October 25
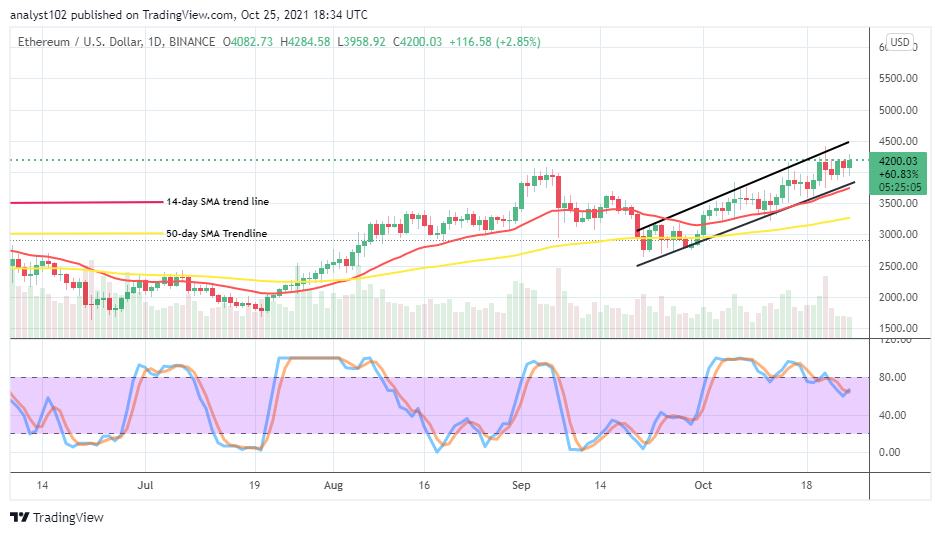
The ETH/USD market breaches northward at $4,000 trading line. The crypto-economic price trades around $4,200 at a positive percentage rate of about 2.85. That signifies that the base trading instrument is dominating the business operations presently.
ETH/USD Market
Key Levels:
Resistance levels: $4,500, $4,750, $5,000
Support levels: $3,750, $3,500, $3,250
ETH/USD – Daily Chart
The ETH/USD daily chart reveals that the market breaches northward at $4,000, holding the valuation closely at a higher notable resistance line at $4,250. The lower bullish trend line conjointly drew alongside the smaller SMA trend line, facing the north side beneath the current price trading zone. The 50-day SMA indicator is underneath the 14-day SMA indicator. The Stochastic Oscillators have over the time, consolidating around higher range lines involving the overbought region. That means some downs also strive to re-surface in the process of the market pushes in the bullish channels.
Will there still be more reliable upside motions as the ETH/USD market breaches northward at $4,000 level?
It would be technically ideal that traders exercise some degrees of trading pre-cautiousness in launching further long positions as the ETH/USD market breaches northward at $4,000 level. Long position takers must allow some notable downs in the terms of retracement on a lower trading chart to get an attempt signifying a rebound in the process to be able to re-consider a buy order.
On the downside, selling forces have to feature around the resistance at $4,500 level before a bearish candlestick can take a form, signaling a sell entry. In addition to the assumption, a false breakout at the higher value line will eventually give more reliable sell-off trading situations that bears can rely on until some sessions. Nevertheless, short position takers needed to always wary of late entries.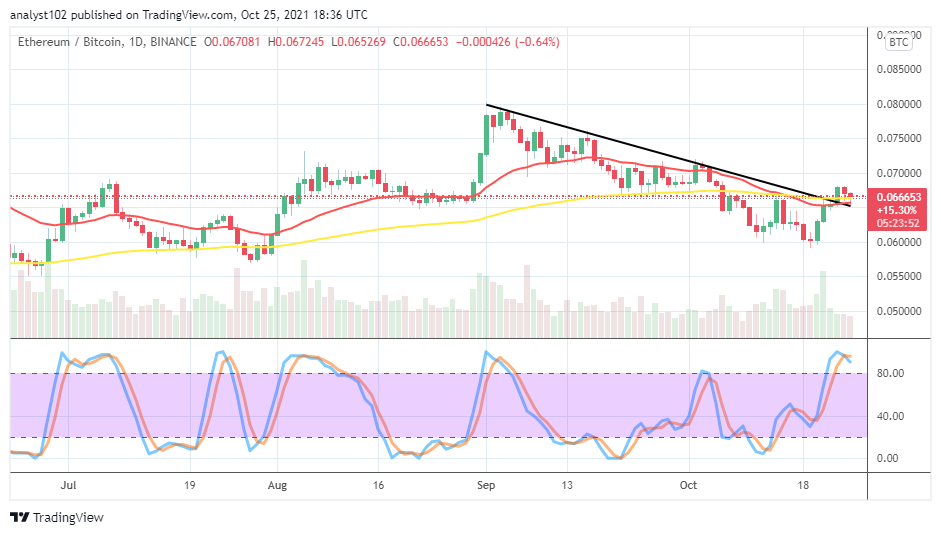
ETH/BTC Price Analysis
In comparison, Ethereum appears, pushing for a recovery against the trending capability of Bitcoin. The cryptocurrency pair market breaches northward briefly against the SMA trend lines. Despite that trading condition, the 14-day SMA indicator is underneath the 50-day SMA indicator. The Stochastic Oscillators are in the overbought region, with the lines slightly crossing to the southbound. That indicates that the base crypto currently experiences a countering pressure inflicted on it by BTC.
Note: Cryptosignals.org is not a financial advisor. Do your research before investing your funds in any financial asset or presented product or event. We are not responsible for your investing results.
You can purchase crypto coins here. Buy Tokens