Ethereum (ETH/USD) Price Loses Momentum Significantly
Estimated Reading Time: 3 minutes
Don’t invest unless you’re prepared to lose all the money you invest. This is a high-risk investment and you are unlikely to be protected if something goes wrong. Take 2 minutes to learn more

Free Crypto Signals Channel
Ethereum Price Prediction – June 13
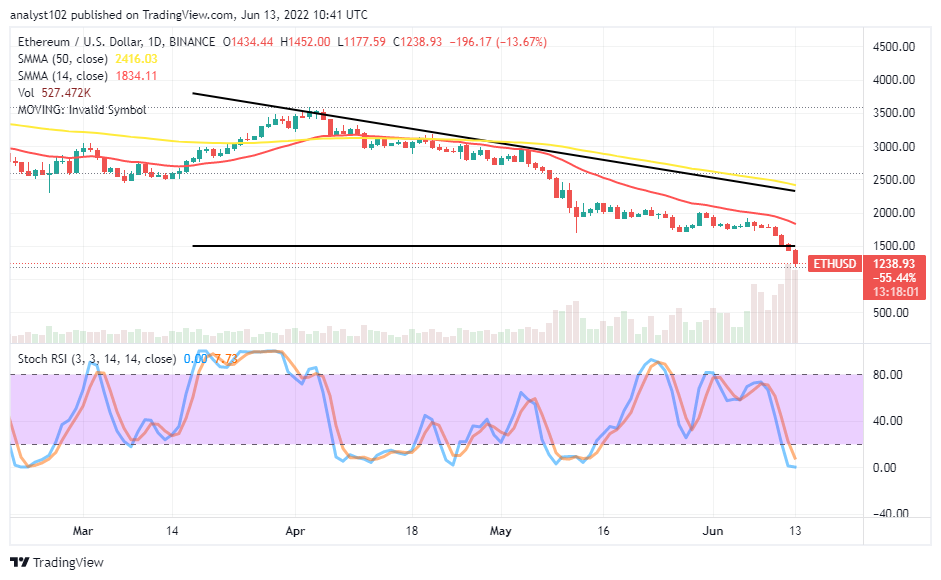
The ETH/USD market’s price loses momentum significantly as it breaks previous variant support levels to the south direction. Price is currently trading between $1,452 and $1,177 points at a negative percentage rate of 13.67.
ETH/USD Market
Key Levels:
Resistance levels: $1,500, $1,750, $2,000
Support levels: $1,000, $750, $500
ETH/USD – Daily Chart
The ETH/USD daily chart showcases the crypto-economic price loses momentum significantly, breaking downward past the $1,500 from yesterday’s session until now. The bearish trend line drew closely beneath the 50-day SMA indicator above the 14-day SMA indicator. The Stochastic Oscillators are in the oversold region, seemingly trying to close at the range of zero. And they still indicate a declining force is in place.
Will the ETH/USD market swing northward soon?
There has been no reliable buy signal to suggest an early recovery motion to allow the ETH/USD market to swing northward soon against the $1,500 resistance level. A lot of cautiousness has to exercise by long-position takers to see if bulls will be able to rebuild energy around the levels before the $1,000 support level in the near time. Operations may run indecisively below the strong line it has breached southward to make a buying entry to be determined.
On the downside of the technical analysis, as there has been a breakdown through the $1,500 level to enter other lower-trading spots, the price stands the tendency of aiming to push southward further toward the $1,000 support line. But, getting off the position entry seems uneasy to get presently. A pull-up that can give back a reversal mode around the line drawn at the value line mentioned earlier will dearly let in a selling order.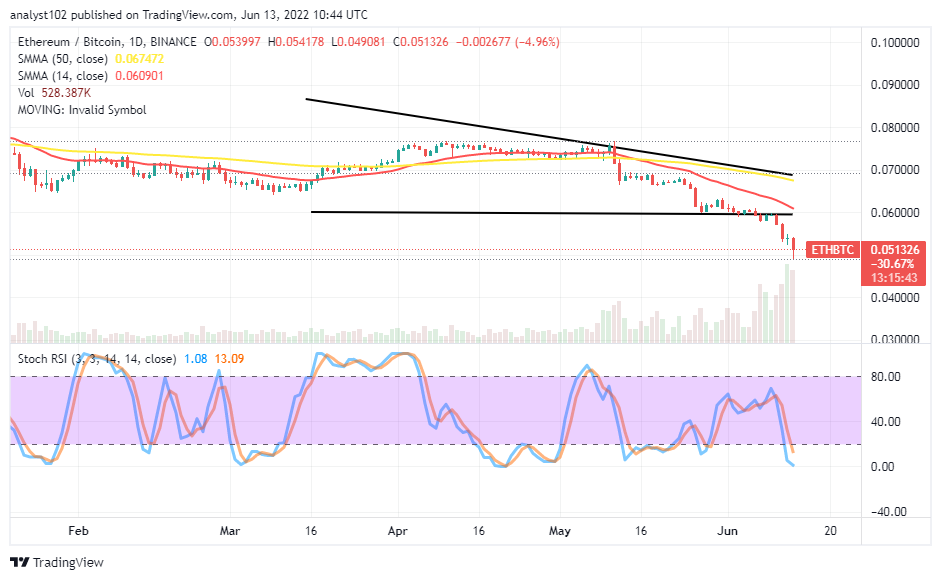
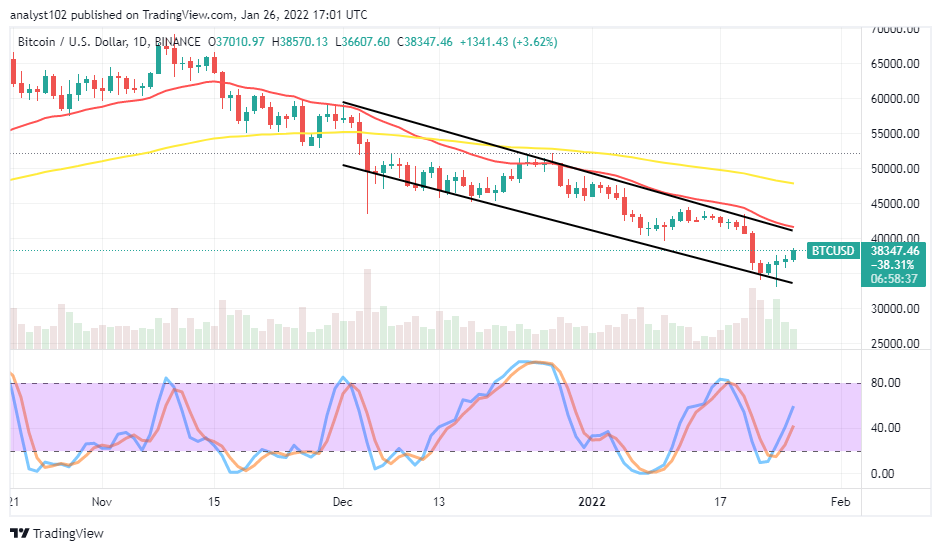
ETH/BTC Price Analysis
Ethereum has elongated downsizing in its trending values against Bitcoin. The 50-day SMA indicator is above the 14-day SMA indicator. Variant candlesticks have emerged in the southward direction against some support levels. The Stochastic Oscillators are in the oversold region. Their presence currently within it is fresh. And, it may be too early to suggest the base crypto will swing upward against the counter-trading crypto.
Note: Cryptosignals.org is not a financial advisor. Do your research before investing your funds in any financial asset or presented product or event. We are not responsible for your investing results.
“Lucky is up more than 50% today but still more than 430% from All Time Highs!
The opportunity to bank BIG is now!
You can purchase Lucky Block here. Buy LBlock