Ethereum (ETH/USD) Reverses Rallying Moves
Estimated Reading Time: 3 minutes
Don’t invest unless you’re prepared to lose all the money you invest. This is a high-risk investment and you are unlikely to be protected if something goes wrong. Take 2 minutes to learn more
Ethereum Price Prediction – May 31
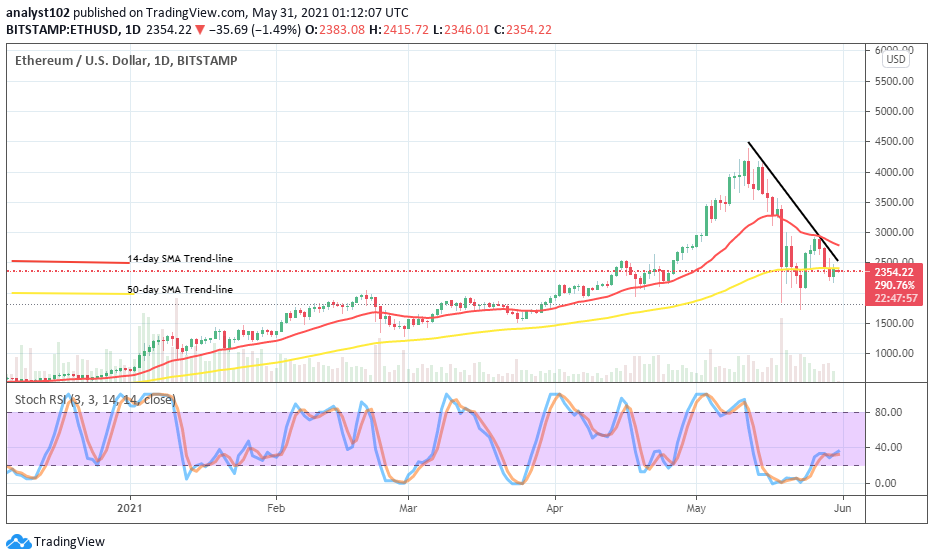
The ETH/USD market worth has reversed rallying moves it embarked upon recently after facing resistance near around the level of $3,000 to now trade a bit below the line of $2,500. As of writing, the crypto trading instrument records about a -2.16% reduction in its valuation.
ETH/USD Market
Key Levels:
Resistance levels: $2,500, $3,000, $3,500
Support levels: $2,000, $1,700, $1,400
ETH/USD – Daily Char
Despite the current visible downward trends in most of all crypto economies, the outlook that the ETH/USD daily chart depicts still appears that the crypto isn’t far from being seeing price corrections as paired with the most global famous fiat currency. The 14-day SMA trend-line is located above the 50-day SMA indicator. The bearish trend-line drew only across the smaller SMA to place a mark at the $2,500 line close over the bigger SMA. The Stochastic Oscillators are situated between ranges 40 and 20 in a manner of seemingly trying to open the hairs toward the north. That probably suggests that an upswing is in the womb of time.
$2,500 resistance level; will the ETH/USD price be able to break past it soon?
Taking a deep more technical approach to trading at the present ETH/USD market position, the level of $2,500 represents the mid-point of $2,000 and $3,000 values to now serve as the main zone in determining the actual next direction of the crypto trade. That said, what could now be a buy decent entry will be while price makes a slight downward move toward or around the lowest point earlier mentioned coupled with an upward reversal.
On the contrary analysis note, as some valuable trading determinant points have observed, the points between the $3,000 and the $2,500 would have to be held strong by the ETH/USD bears to stage a come-back in the next sessions. They also need to exert their entry with a good policy of trading techniques. The reason is that the ETH/USD market still has some degree of upsides to feature at later sessions.
ETH/BTC Price Analysis
The comparison of price trending movement between Ethereum and Bitcoin appears on the chart that the base crypto has been facing a kind of correctional situation as paired with the counter flagship trading instrument. Price is now hovering around the smaller SMA. The 50-day SMA indicator is located underneath the 14-day SMA trend-line as the bullish trend-line remains drawn between them to play a supportive role to the smaller technical trading indicator. The Stochastic Oscillators are seemingly consolidating around range 20 having recently moved up from the oversold region. That potentially suggests that in the near sessions, the base crypto will be having more upper hands of trending in the crypto market space than the chief most expensive counter instrument.
Note: new.cryptosignals.org is not a financial advisor. Do your research before investing your funds in any financial asset or presented product or event. We are not responsible for your investing results.