Ethereum (ETH/USD) Witnesses a Price Correction Southward
Estimated Reading Time: 3 minutes
Don’t invest unless you’re prepared to lose all the money you invest. This is a high-risk investment and you are unlikely to be protected if something goes wrong. Take 2 minutes to learn more
Ethereum Price Prediction – May 17
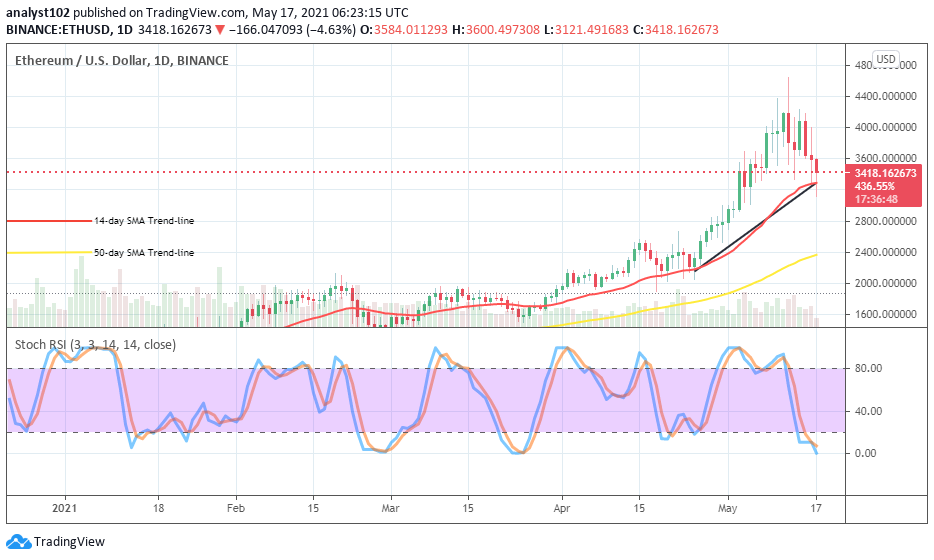
After a brief appreciation in the valuation of the ETH/USD market past the resistance level of $4,500, the crypto’s value resumed lowering for a huge correction down to eventually approach a lowly point of $3,000 during today’s session. As of writing, price is trading with about a negative 4.14% at around the level of $3,435.
ETH/USD Market
Key Levels:
Resistance levels: $3,800, $4,200, $4,600
Support levels: $3,000, $2,800, $2,600
ETH/USD – Daily Chart
The ETH/USD daily chart has depicted that the crypto-market begun to make a financial record of an uptrend correction on May 12 after the crypto’s value slightly surged past the point of $4,500. The downward correction gets heightened during today’s session to closely average the immediate support of $3,000 after a short breakdown of the smaller SMA. In the meantime, the bullish trend-line and the 14-day SMA trend-line are drawn to get positioned at the level of $3,200 to indicate the first warning zone that further sell-off trading situation could get trapped in no time. The 50-day SMA indicator is located at the point of $2,400 far below.
Will there be any possibility that the ETH/USD go more for correction?
A long hold of the ETH/USD market line between the points of $3,200 and $3,600 may potentially lead to a further breakdown in a correctional moving mote. However, it is indicated by the Stochastic Oscillators that the downward pressure has been getting reduced on a gradual process. And, that will give back a bullish formation baseline in the next session. In addition, intending investors are now enjoined to brace up for their entry.
On the downside, an outright breakdown of the $3,200 level is most needed to allow a free-fall of this crypto-economy down for lower values. The market needs to face a rejection around a higher point of $3,600 for a return of an active sell-pressure to be able to make a better stance for bears in their pushes.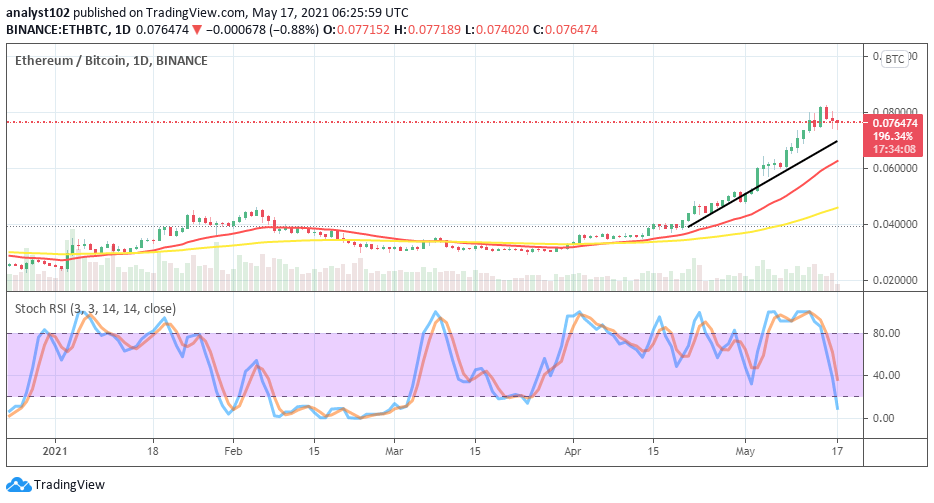
ETH/BTC Price Analysis
In comparison, ETH’s market still currently outpaces the trading situation as paired with BTC. There has only been a pit stop at a higher line above the SMA indicators. The 50-day SMA is underneath the 14-day SMA trend-line. And, the bullish trend-line is drawn over the smaller SMA pointing to the north. The Stochastic Oscillators have slightly swerved down to touch a point in the oversold region. That indicates that the base crypto is getting prepared for a potential upward push.
Note: cryptosignals.org is not a financial advisor. Do your research before investing your funds in any financial asset or presented product or event. We are not responsible for your investing results.