Litecoin (LTC/USD) Economic Operation Downsizes
Estimated Reading Time: 3 minutes
Don’t invest unless you’re prepared to lose all the money you invest. This is a high-risk investment and you are unlikely to be protected if something goes wrong. Take 2 minutes to learn more
Litecoin Price Prediction – December 7
At last, the LTC/USD market loses momentums as the crypto-economic operation downsizes in its valuation to trade around $156 line close to the lower range-line. The crypto trade’s percentage rate of trading observed around 0.72 negatives. That signifies that some depression trading elements are still inflicting effects on the market to some extent.
LTC/USD Market
Key Levels:
Resistance levels: $200, $225, $250
Support levels: $150, $125, $100
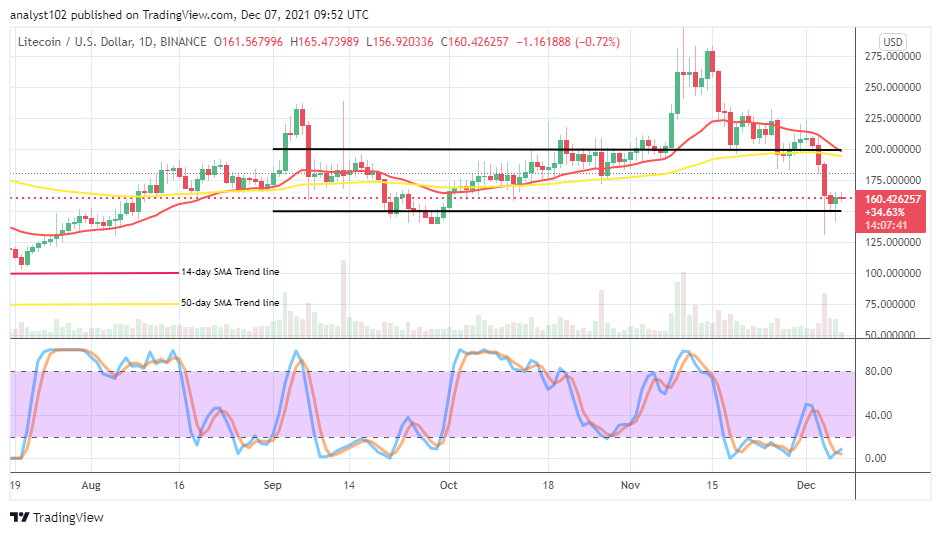
LTC/USD – Daily Chart
The LTC/USD daily chart reveals that the crypto-economic market operation downsizes, finding support at a lower range level. It needed to sound note-worthy that the lower range-level forcefully breached momentarily during the last volatile bearish movement, which occurred on December 4th day session. The 14-day SMA indicator has closely bent southward above the 50-day SMA indicator. The Stochastic Oscillators are in the oversold region with a sign of crossing the lines faintly northbound. That suggests that the crypto economy is somewhat preparing to regain its lost valuation as trade with the US Dollar.
Is it now technically ideal that traders may start to launch long positions as the LTC/USD economic operation downsizes?
To some reasonable extent, the LTC/USD market traders begin to look out for decent buying entries as the crypto-economic operation downsizes to trade around $150 lower range-line. The set of trading candlesticks that forms around the lower value range-line doesn’t portend a fast-trading approach, allowing long positions to be currently. Based on that sentiment, some degrees of patience may still need to exercise on the part of long-position takers of the market.
On the downside continuation of the depression, technical analysis of the LTC/USD trade, short-position takers would have to be extraordinarily careful about launching more sell orders around $150. It is expected that some downing pressures may play out. But, it will likely be to cause a bears’ trap-trading situation. As a result of that bias, further execution of sell orders may suspend for a while.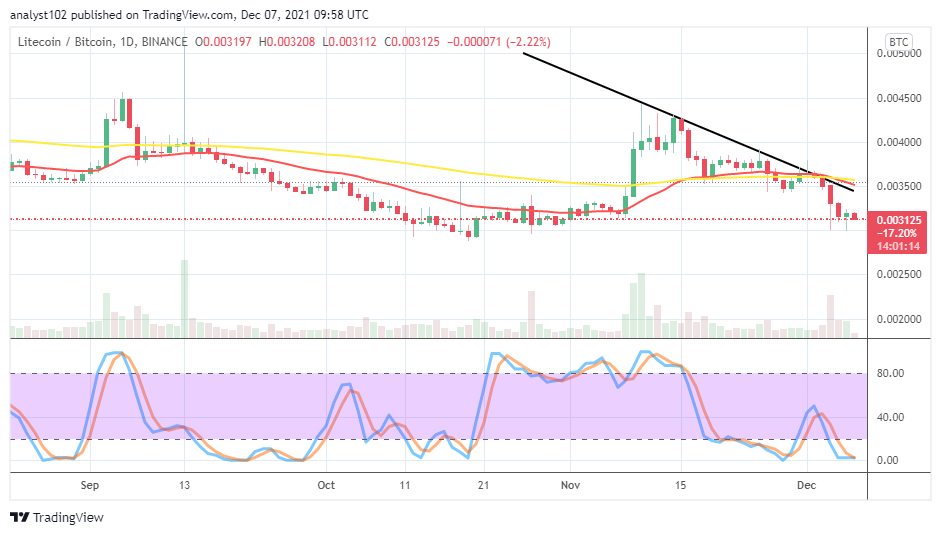
LTC/BTC Price Analysis
In comparison, Bitcoin as the counter trading instrument against Litecoin market price has predominantly overwhelmed the trending pace. The cryptocurrency pair economic operation downsizes underneath the trading indicators to affirm that LTC is still under pressure pairing with BTC. The 14-day SMA trend line has briefly crossed the 50-day SMA trend line to the south side. The Stochastic Oscillators are in the oversold region with closed lines relatively denoting a beginning of a consolidation moving style at the range of zero. That suggests that the market may soon find support to build up its way back upward in no time.
Note: Cryptosignals.org is not a financial advisor. Do your research before investing your funds in any financial asset or presented product or event. We are not responsible for your investing results.
You can purchase crypto coins here. Buy Tokens