Litecoin (LTC/USD) Market Converges, Decreasing Slightly Below $100
Estimated Reading Time: 3 minutes
Don’t invest unless you’re prepared to lose all the money you invest. This is a high-risk investment and you are unlikely to be protected if something goes wrong. Take 2 minutes to learn more
Litecoin Price Prediction – April 9
As there had been a condition to denote that bulls ability to surge further highly in the operations of Litecoin against the valuation of the US Dollar, this reveals that the crypto trade converges at a higher zone, decreasing slightly below the line of $100.
A crypto path of indications has been maintained, showcasing that a buy crypto signal is underway. It would be a good approach to await the resurfacing of a bullish candlestick to confirm the possibility of getting back a good reproach of gaining bract the paths to the upside at a particular point in time.
LTC/USD Market
Key Levels:
Resistance levels: $110, $120, $130
Support levels: $85, $80, $75
LTC/USD – Daily Chart
The LTC/USD daily chart reveals that the crypto economy converges beneath the line of $110, decreasing slightly below the point of $100.
The Bollinger Band trend lines are being positioned from the upper end in accordance with the pressure to the downside. The lower Bollinger Band trend line is strategically positioned at a far lower spot to mark the worst scenario the market can push before getting formidable stances. The stochastic oscillators are in a slight bending posture in the oversold region.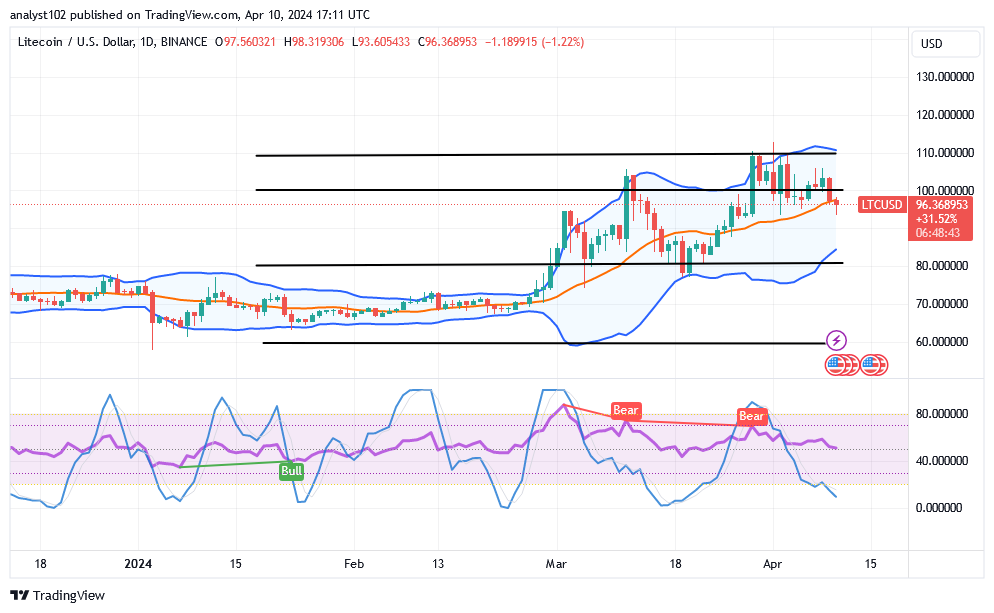
What is the likelihood that the price of litecoin (LTC) won’t move farther below the middle Bollinger Band?
A bearish candlestick is in the making to suggest that some reduction levels are tenable around the middle Bollinger Band as the LTC/USD market converges underneath the point of $110, decreasing slightly below the point of $100.
When a bullish candlestick emerges, it can signal to bulls that it’s time to start preparing for a reversal. Based on the stochastic oscillators as of this analytical period, some lower lows are likely to occur if the oscillators refuse to point back upward.
The price may be seeking to touch some values in the method of averaging the lower location if bears are holding a consolidation trade belief about the path of the middle Bollinger Band. Additionally, the main support line for the assumption is positioned at or close to $80 over the long term.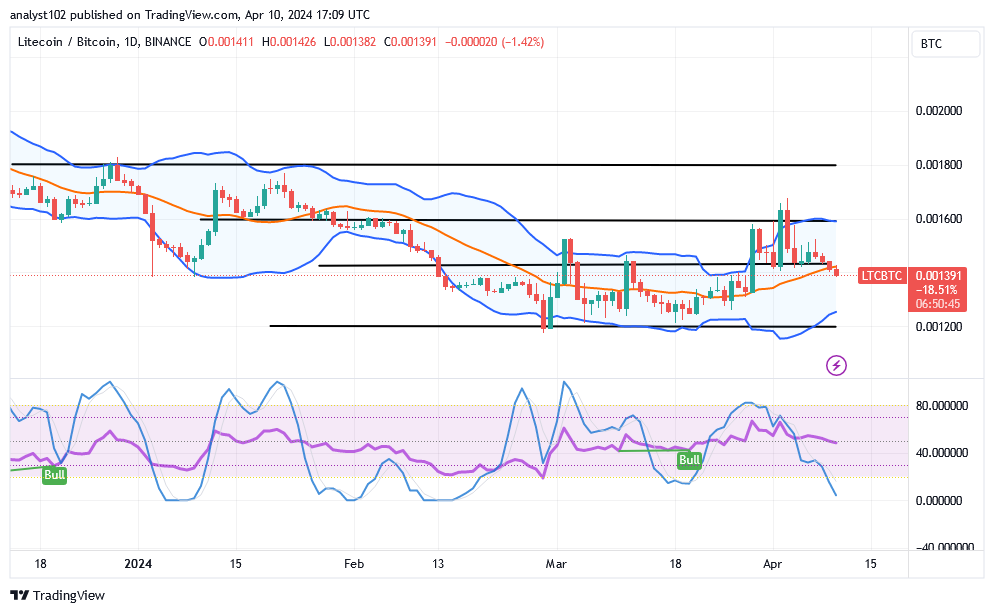
LTC/BTC Price Analysis
In contrast, the Litecoin market converges at higher spots versus the trending ability of Bitcoin, decreasing slightly in the middle Bollinger Band.
The fact that the stochastic oscillators are in the oversold area indicates that there is pressure acting against the core cryptocurrency. The Bollinger Band trend lines indicate that even though a positive turn in the market is unlikely to occur anytime soon, the remaining falls in the market don’t seem to be bearing much weight.
Note: Cryptosignals.org is not a financial advisor. Do your research before investing your funds in any financial asset or presented product or event. We are not responsible for your investing results.
You can purchase Lucky Block here. Buy LBLOCK