Litecoin (LTC/USD) Market Downsizes to $50
Estimated Reading Time: 3 minutes
Don’t invest unless you’re prepared to lose all the money you invest. This is a high-risk investment and you are unlikely to be protected if something goes wrong. Take 2 minutes to learn more

Free Crypto Signals Channel
Litecoin Price Prediction – September 20
There has been no catalyst to suggest the LTC/USD trade will push upward back into a bullish trend over several sessions as the crypto market downsizes to the $50 line. The crypto-economic price, as of the time of writing, trades at $51.75 at an average negative percentage rate of 2.19.
LTC/USD Market
Key Levels:
Resistance levels: $65, $70, $75
Support levels: $45, $35, $30
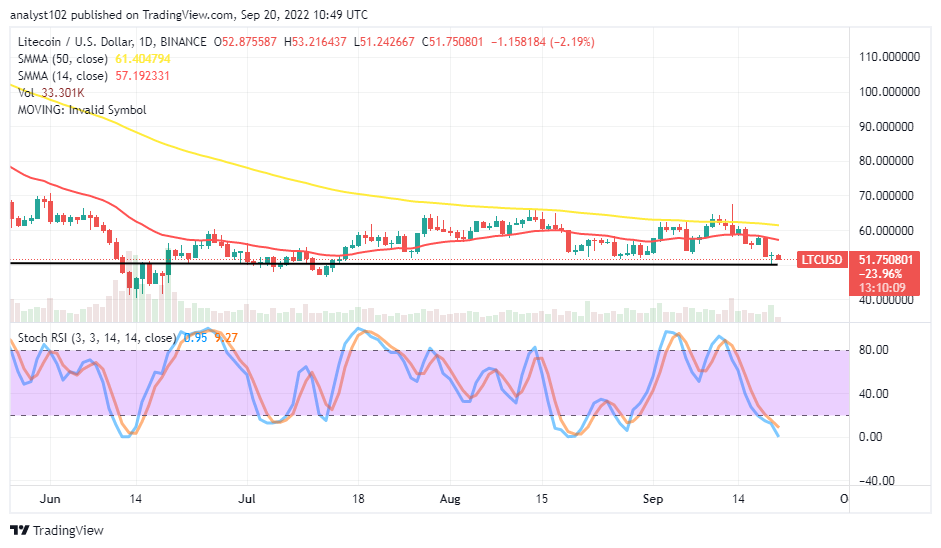
LTC/USD – Daily Chart
The LTC/USD daily chart reveals the crypto-economic market downsizes to the $50 level during yesterday’s operations. The 14-day SMA indicator is at $57.192331, underneath the $61.404794 value line of the 50-day SMA indicator. The Stochastic Oscillators are in the oversold region, briefly pointing southbound at 9.27 and 0.95 range values. The current emergence of a bearish candlestick signifies that a declining motion can play out around the horizontal line drawn.
Will the LTC/USD market bears run sustainably underneath the $50 level afterward?
Trading activities may hold less active price actions than can characterize by lower lows around the $50 level and some points before the $40 support level in the run. It would be technically and timely ideal to get a rebound on a lower time frame, such as a 1-hour chart or 4-hour chart, to let bulls get reset to resume an upward motion when a bullish candlestick forms significantly at a lower-trading zone.
On the downside of the technical analysis, the LTC/USD market bears are seemingly preparing to take a final move around the horizontal line of $50. Short-position takers need to be wary of exerting new positions to avoid an unnecessary whipsawed trading condition in no time. Even if the price has to go more dipping against the value line in question, it will allow bulls to get energized from a lower-trading zone toward the lower support level at $40.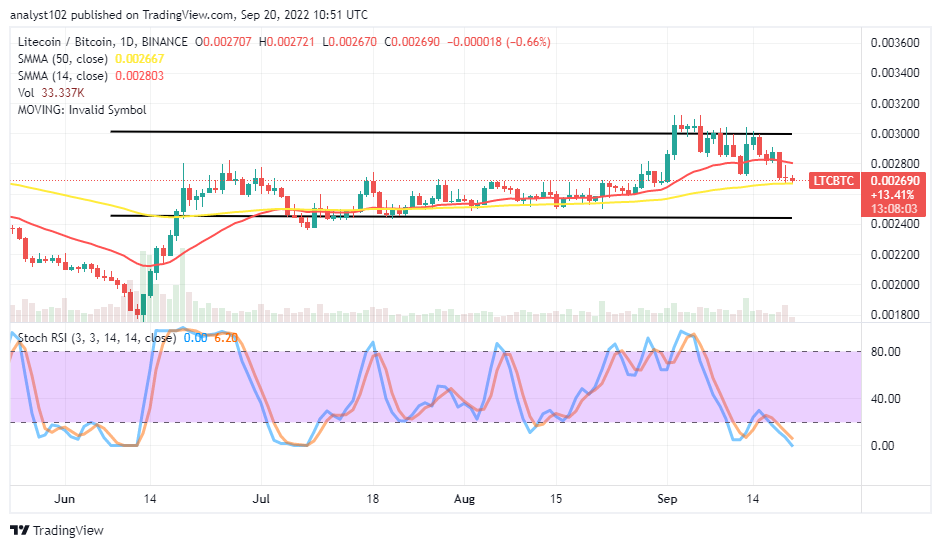
LTC/BTC Price Analysis
In comparison, Litecoin has dropped at a high-trading spot to test the trend line of the bigger SMA, probably to regain support to swing up against the trending ability of Bitcoin in the near time. The 50-day SMA indicator is underneath the 14-day SMA indicator. The upper and lower horizontal lines ascertain the trading pace that the pairing crypto features over time. The Stochastic Oscillators have crossed southbound from below the 40 range into the oversold region, pointing toward the downside at 6.20 and 0.00 range points. That portends the counter crypto is on the verge of relaxing its trending force against the base crypto sooner than later.
Note: Cryptosignals.org is not a financial advisor. Do your research before investing your funds in any financial asset or presented product or event. We are not responsible for your investing results.
You can purchase Lucky Block here. Buy LBLOCK