Litecoin (LTC/USD) Market Features in Ranges
Estimated Reading Time: 3 minutes
Don’t invest unless you’re prepared to lose all the money you invest. This is a high-risk investment and you are unlikely to be protected if something goes wrong. Take 2 minutes to learn more
Litecoin Price Prediction – October 19
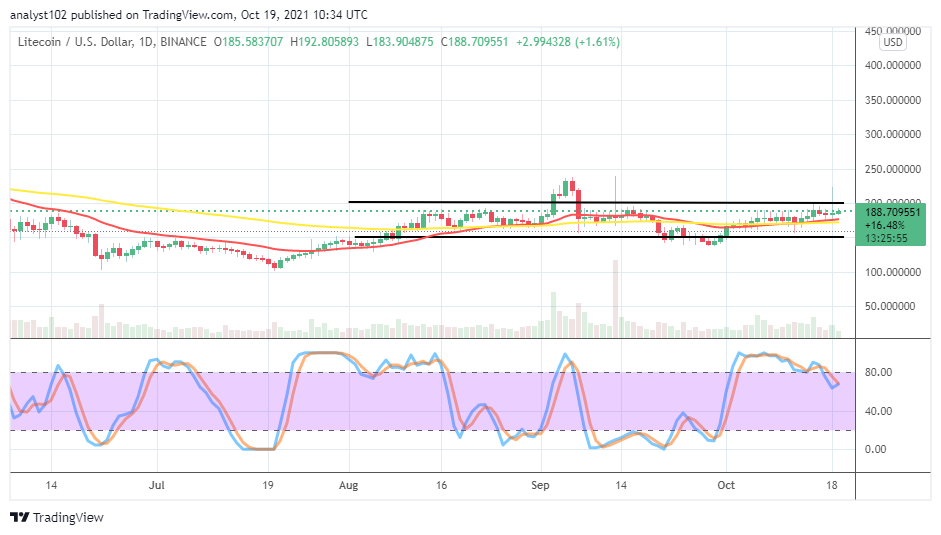
It observed that the LTC/USD market features in ranges of $200 and $150 after it couldn’t sustain an upward motion it incurred past the higher value-line recently. The crypto’s trading line is around $188 level at a percentage rate of about 1.61.
LTC/USD Market
Key Levels:
Resistance levels: $200, $240, $280
Support levels: $150, $130, $110
LTC/USD – Daily Chart
The LTC/USD daily chart showcases that the crypto business market features in ranges of $200 and $150 levels. The cryptocurrency pair price broke the immediate resistance level during yesterday’s session but, shortly, it reversed back into the range-bound lines. The 14-day SMA trend line and the 50-day SMA trend line are conjoined in a smaller-slanting manner to the upside within the range levels. The Stochastic Oscillators have slowly slanted southbound against the range of 80. That signifies that indecision is currently playing in the crypto-economic market operations.
How do traders approach the current situation as the LTC/USD market features in ranges of $200 and $150?
It is more distinct as the LTC/USD market features in ranges of $200 and $150 different trading approaches may apply by traders. It recommended that long position takers be on the lookout for active price motion resulting from pull-downs of the market to determine when it will be technically ideal to launch a buy order. A lot of patience will require achieving that. However, investors may consider joining the market operations from this point or even while price tends to go more dipper.
On the downside analysis, the LTC/USD market sellers majorly should look out for the market’s inability to regain its catalyst to re-push northward away from the value line at $200. A sudden breakdown at the lower range trading level at $150 may cause traders to keep their trading techniques based on taking their profits at the two ends out of such operations. And, if a buy order had been at the lower range line, the position will be open to losses which could cause a panic situation, especially for short-term traders.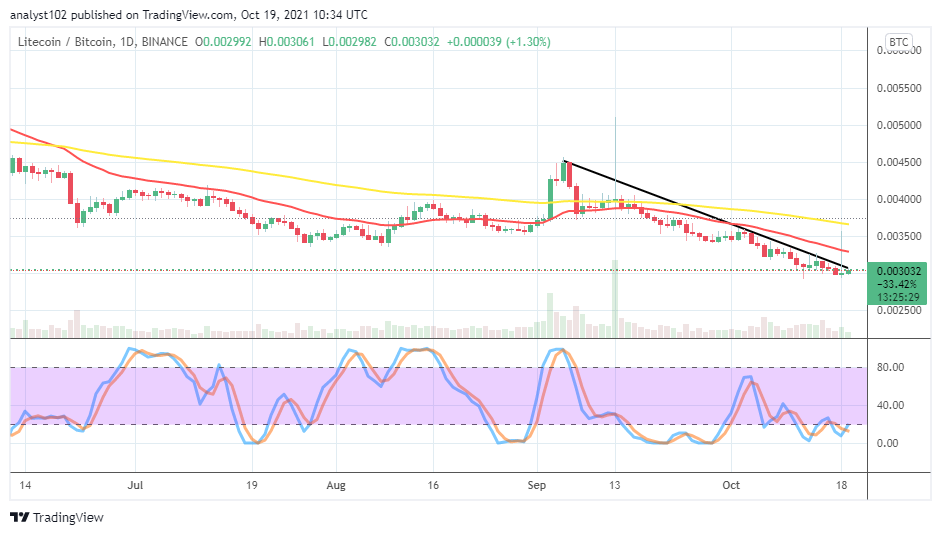
LTC/BTC Price Analysis
In comparison, the LTC/BTC daily price analysis chart shows that the base crypto is lower in trending capacity as paired with the counter crypto. The 14-day SMA trend line is underneath the 50-day SMA trend line. The bearish trend line drew southward across the SMA indicators, touching the higher points of variant bearish candlesticks to the downside. The Stochastic Oscillators are seemingly consolidating around the range of 20 and the oversold region. That suggests that there is every likelihood that the counter crypto pushes with more force at the expense of the base crypto’s weaknesses.
Note: Cryptosignals.org is not a financial advisor. Do your research before investing your funds in any financial asset or presented product or event. We are not responsible for your investing results.
You can purchase crypto coins here. Buy Tokens