Ethereum (ETH/USD) Bulls Eye New High Amid Overbought Caution
Estimated Reading Time: 3 minutes
Don’t invest unless you’re prepared to lose all the money you invest. This is a high-risk investment and you are unlikely to be protected if something goes wrong. Take 2 minutes to learn more

Ethereum Long-term Analysis: Bullish
Ethereum against the United States Dollar has gained more upside traction since last week, rallying above key resistance levels and attracting increased market interest. However, the Stochastic oscillator signals caution as the pair approaches an overbought region.
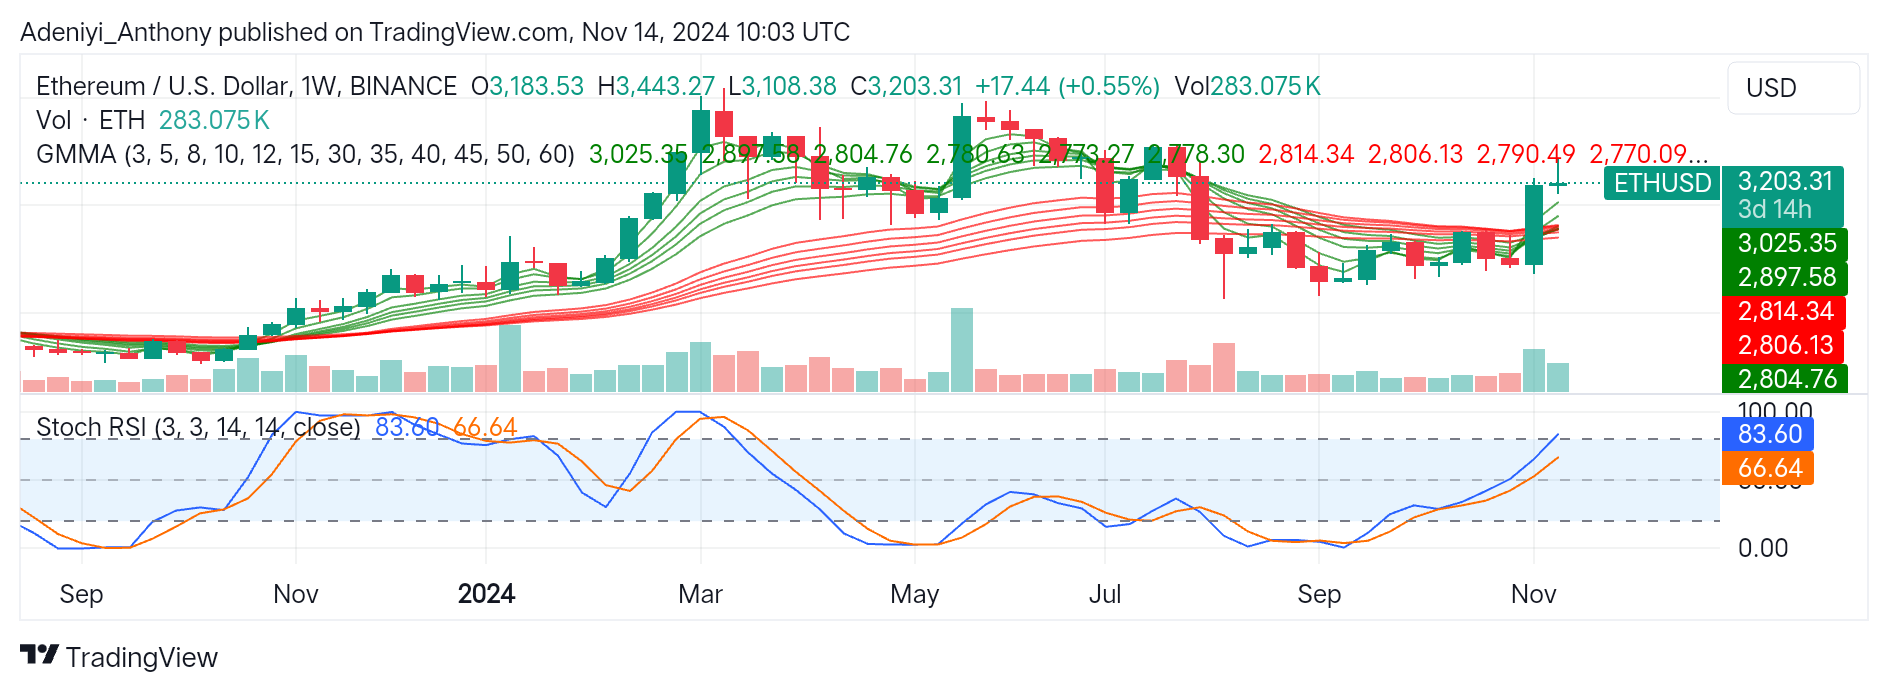
Recently, ETH/USD has been trending above the Guppy Multiple Moving Averages (GMMA) with a volume of 283.075k, indicating steady bullish interest without a significant spike. However, the coin seems to be operating at a crucial juncture with a small gain of 0.55%, suggesting some caution as the buying pressure reduces.
Currently, ETH/USD trades at $3,203.31 with the possibility of breaking above $3,443.27 provided the bulls maintain the current momentum. To this end, a break below this level may see the price testing the support level at $2,780.63.
Technical Indicators
Major Resistance Levels: $3.443.27, $3,600, and $3,700
Major Support Levels: $2,780.63, $2,730.27, and $2,678.30
Ethereum Technical Analysis
The weekly analysis of Ethereum against the United States Dollar shows that the pair has broken through several resistances and is attempting to establish new support levels. The price actions above the GMMA suggest that the buyers are currently in control of the market. The alignment indicates that both the short-term traders and the investors are optimistic about Ethereum’s potential further gains. However, considering the gap between the two sets of moving averages, the pair may see some minor pullback soon.
The Stochastic RSI on this chart signals that the pair may be overextended and be due for a pullback. Though there is room for more upside movement, the price needs to break above $3,203.31 to test the $3,443.27 level; otherwise, a spike in volume and a dip in price towards the $2,780.63 may see the pair testing lower supports.
ETH/USD Analysis: Where from Here?
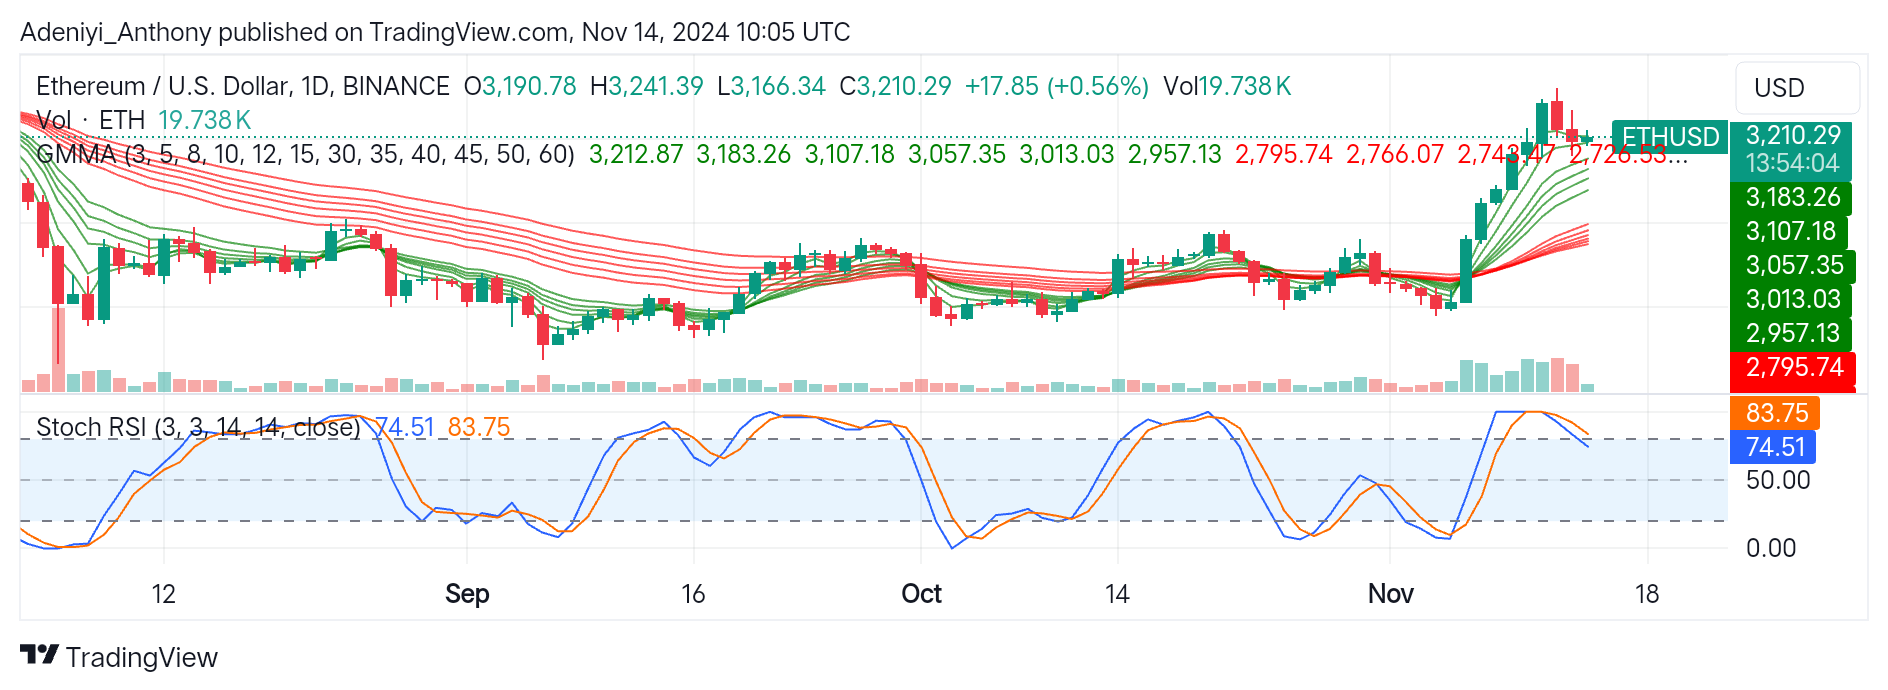
On the daily timeframe, ETH/USD is trading at $3,210.29 with a slight increase of 0.56%, indicating an upside movement after a minor retracement. The GMMA on the chart below presents a bullish setup with wide gaps, suggesting a strong bullish trend. However, the market may consolidate if buying pressure reduces, as seen in the low trading volume.
On the other hand, the Stochastic oscillator suggests the pair may be due for a pullback as the pair is overbought. However, ETH/USD may resume the uptrend with a dip in price above the $2,957.13 support level with a spike in trading volume.
You can purchase crypto coins here. Buy Block