Litecoin (LTC/USD) Market Loses Momentum Close to $240
Estimated Reading Time: 3 minutes
Don’t invest unless you’re prepared to lose all the money you invest. This is a high-risk investment and you are unlikely to be protected if something goes wrong. Take 2 minutes to learn more
Litecoin Price Prediction – September 7
It recorded that the LTC/USD market loses momentum while it tried to move closer to the level of $240 during the recent trading activities. The crypto’s price trades around a negative number of 6.26 percentage rate at a market level of about $205 as of writing.
LTC/USD Market
Key Levels:
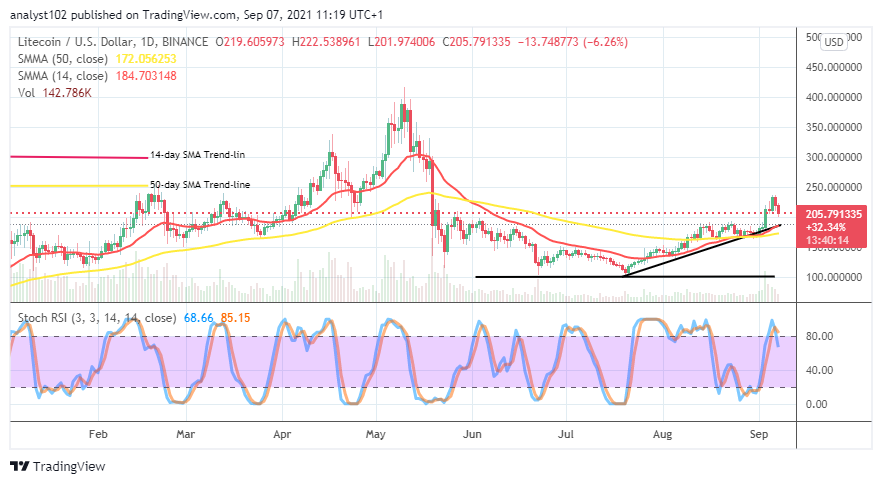
Resistance levels: $240, $280, $320
Support levels: $180, $160, $140
LTC/USD – Daily Chart
The LTC/USD daily chart records that the crypto market loses momentum, having managed to move closer to the level of $240. The bullish trend-line drew northward alongside the 14-day SMA indicator, intercepting the 50-day SMA trend-line to the north side. Variant candlesticks have appeared above the positioning of the indicators. The Stochastic Oscillators have crossed the lines southbound against the range 80. That shows that the US Dollar may soon depress the crypto market once again.
Will there be further pressure on the LTC/USD price valuation as the market loses momentum at a higher level?
The present losing of stance by the LTC/USD market bulls may, in the end, amount to a kind of price correction. As currently recorded that the crypto market loses momentum while it moved closer to the $240, it is technically ideal that traders needed to be cautious of exerting new trading positions. A downward motion, encountering a strong support baseline at a lower depth of trading zone, may in the long give way to price rallying manner.
On the downside, as it observed that a higher trading level around the $240 resistance line witnessed a rejection now leading to the start of a downward force, the LTC/USD market bears needed to capitalize their presence from that point. A quick rallying motion against the line will decimate it in favor of getting to see some upsides returning into the market. All in all, it could still be that time of investing is on until now.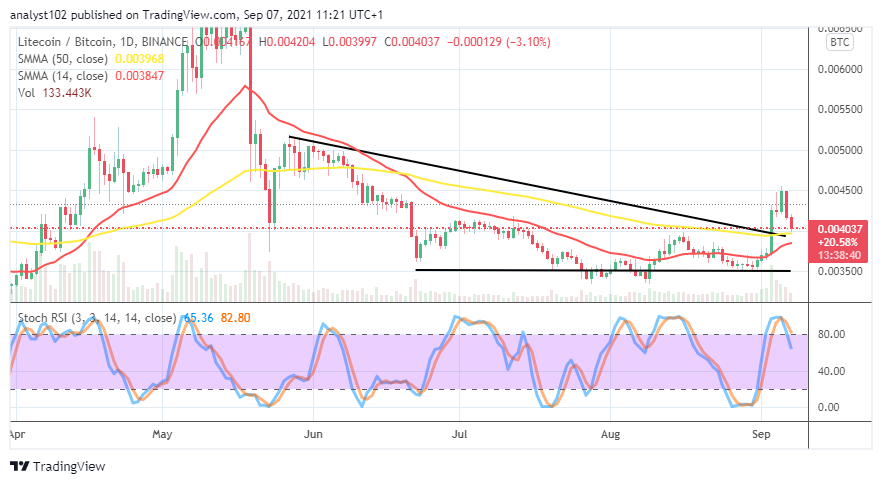
LTC/BTC Price Analysis
In comparison, it appears that there is a sign of early reduction of trending capacity in the base crypto as paired with the flagship counter crypto. The LTC/BTC price analysis chart showcases that the duo-crypto market lost momentum when it moved northward away from the indicators. The market now draws down near the bigger SMA trend-line. The 14-day SMA indicator has strived to move closer beneath the 50-day SMA indicator. The Stochastic Oscillators have slightly crossed the lines southbound against the range 80. That suggests that there may be a slight downward shift in the pushing capability of LTC as paired with BTC soon.
Note: Cryptosignals.org is not a financial advisor. Do your research before investing your funds in any financial asset or presented product or event. We are not responsible for your investing results.
You can purchase crypto coins here. Buy Tokens