Litecoin (LTC/USD) Market Point Hovers at $160
Estimated Reading Time: 3 minutes
Don’t invest unless you’re prepared to lose all the money you invest. This is a high-risk investment and you are unlikely to be protected if something goes wrong. Take 2 minutes to learn more
Litecoin Price Prediction – August 13
There has been a gradual increase in the LTC/USD’s valuation as the market point hovers around the level at $160. In the recent past, the crypto was struggling to push upward around $140. As of writing, the trading rate of the crypto economy is seen at around 1.15% increases.
LTC/USD Market
Key Levels:
Resistance levels: $200, $240, $280
Support levels: $140, $120, $100
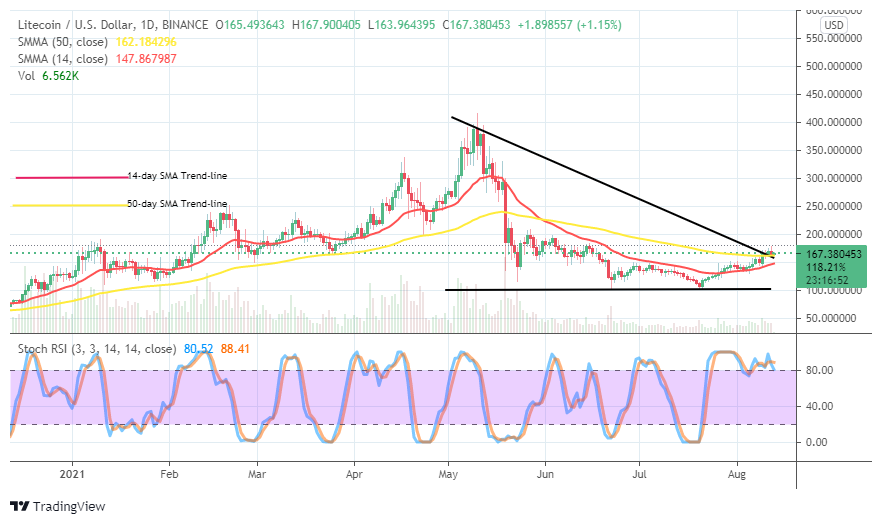
LTC/USD – Daily Chart
The LTC/USD daily chart pictures that the crypto market point hovers around the level of $160 presently, having had tougher sessions around $150 trading line. The 14-day SMA trend-line has curved northward to touch the line at $150 near beneath the 50-day SMA trend-line. The bearish trend-line drew southward to touch the bigger SMA at the buy signal side. The Stochastic Oscillators are somewhat erratically consolidating in the overbought region to signify a difficult projectable trading situation of the crypto economy.
How soon could there be a change in the current price direction as the market points hovers around $160?
Emergence of an aggressive motion needed to take place either upwardly or downwardly before a definite change of price direction can be obtained as the LTC/USD market point hovers now at a higher line around $160. A sudden price movement against the trend-line of the 14-day SMA may allow some of the subsequent trading days witness some degrees of downs possibly in smaller proportion to see through some lower trading lines. The points between $150 and $100 have to be the resort to expect price to spring up either in the short, medium or long term.
On the downside, the LTC/USD bears must hold stronger against any probable price upsurge around the mid-point of $150 and $200. Going by the readings of the Stochastic Oscillators, the crypto market appears to face tougher striding situations especially if price is strongly resisted around the immediate resistance level at $200. On the contrary, a sustainable breakup at that level will most likely propel the market to more higher values afterward.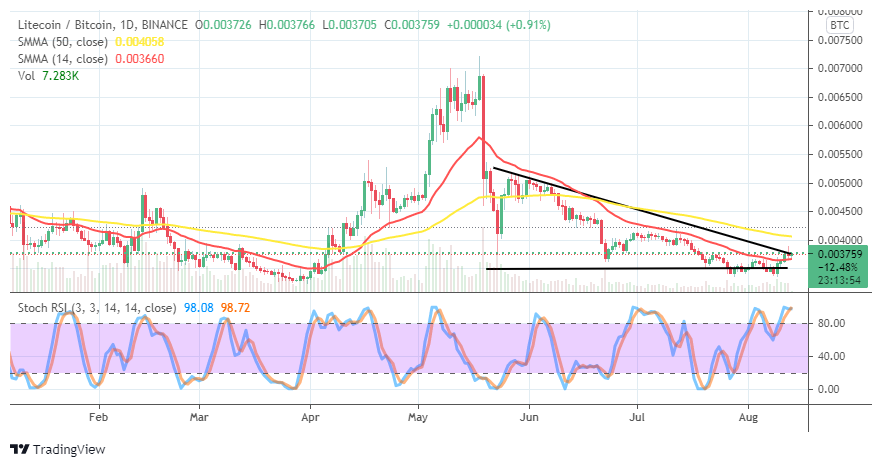
LTC/BTC Price Analysis
In comparison, Litecoin has been able to pull much trending capacity against Bitcoin. Even there has been a sign of trade capacity rallying in the LTC/BTC price. Yet, the base crypto outweighed by the flagship counter crypto. The 50-day SMA indicator stays above the 14-day SMA indicator to affirm that the trending weight favors the base trading instrument. The Stochastic Oscillators are in the overbought region, suggesting that LTC may for a while remains outweighed in trending by BTC.
Note: Cryptosignals.org is not a financial advisor. Do your research before investing your funds in any financial asset or presented product or event. We are not responsible for your investing results.
You can purchase crypto coins here. Buy Tokens