Litecoin (LTC/USD) Price Is Unable to Surge Past $65 Level
Don’t invest unless you’re prepared to lose all the money you invest. This is a high-risk investment and you are unlikely to be protected if something goes wrong. Take 2 minutes to learn more

Free Crypto Signals Channel
Litecoin Price Prediction – September 14
It has been that the LTC/USD market price is unable to surge past the $65 resistance line. The movement motion of the crypto economy has been less active to a large extent that it occurs between a tight space of $59.99 and $58.56 at an average percentage rate of 1.14 positive.
LTC/USD Market
Key Levels:
Resistance levels: $65, $70, $75
Support levels: $50, $45, $35
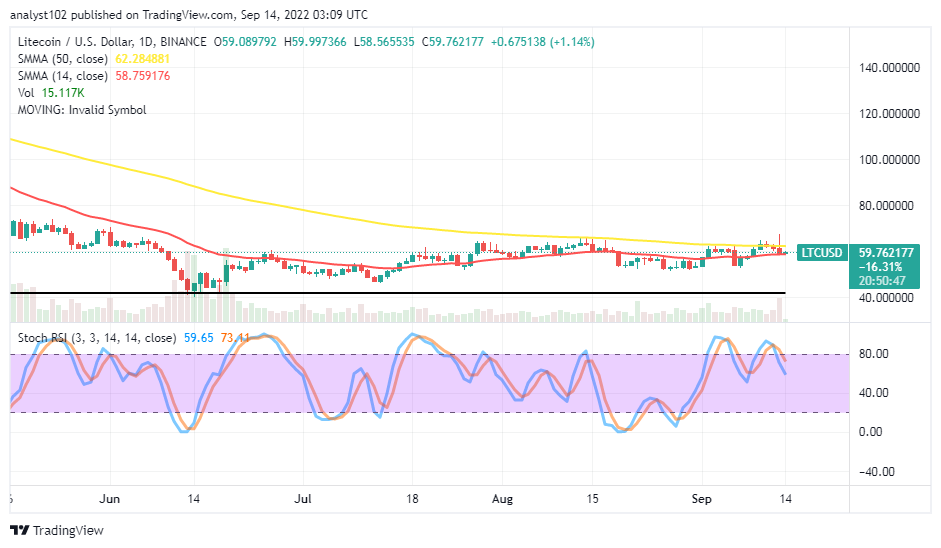
LTC/USD – Daily Chart
The daily chart showcases the crypto-economic price is unable to surge past the $65 resistance level. The horizontal line remains drawn at $42, far below the trend lines of the SMAs. The 14-day SMA indicator is at $58.76, below the $62.29 value point of the 50-day SMA indicator. The Stochastic Oscillators have crossed southward, reaching the 73.11 and 59.65 range values. It signifies there may still be room for a drawdown to play out in the following days’ transactions.What is technically ideal to be traders approach in the LTC/USD market operation presently?
The LTC/USD market traders’ approach that is technically ideal at the moment is staying clear-off the operation pending the time that a formation denotes a change of direction away from the current trading spot as the price is unable to surge past the $65 resistance level. Long-position takers should be cautious of taking a re-launch of buying order position until the trading situation bags a reading of lowly-rated range values before considering leveraging on any attempt to spike northward.
On the downside of the technical analysis, short-position placers need to be vigilant about taking a new order on the threshold of the moving forces to the downside underneath the trading barrier point of the 50-day SMA at $62.29. Sellers also need to be cautious when taking a new position because the falling pressure exhibited presently isn’t that weighty enough to push headlong downward that bulls can count upon for a long time. LTC/BTC Price Analysis
Litecoin appears to be on the move northward back against Bitcoin after it found support closely below the trend line of the smaller SMA. The 50-day SMA indicator is underneath the 14-day SMA indicator. And their movements so far reflect a range pattern against other directions. The Stochastic Oscillators are in the oversold region, keeping 22.00 and 12.54 range values. It portends the base crypto possesses the probability of pushing against its counter-trading crypto soon.
Note: Cryptosignals.org is not a financial advisor. Do your research before investing your funds in any financial asset or presented product or event. We are not responsible for your investing results.
You can purchase Lucky Block here. Buy LBLOCK