Litecoin (LTC/USD) Price Swings Up and Down at $150
Estimated Reading Time: 3 minutes
Don’t invest unless you’re prepared to lose all the money you invest. This is a high-risk investment and you are unlikely to be protected if something goes wrong. Take 2 minutes to learn more
Litecoin Price Prediction – January 4
A series of trading activities have been featured in the LTC/USD market operations as crypto-economic price swings up and down at $150. It currently recorded that the crypto’s worth trades between $149 and $146 at a minute negative percentage rate of about 0.02.
LTC/USD Market
Key Levels:
Resistance levels: $175, $200, $225
Support levels: $135, $115, $95
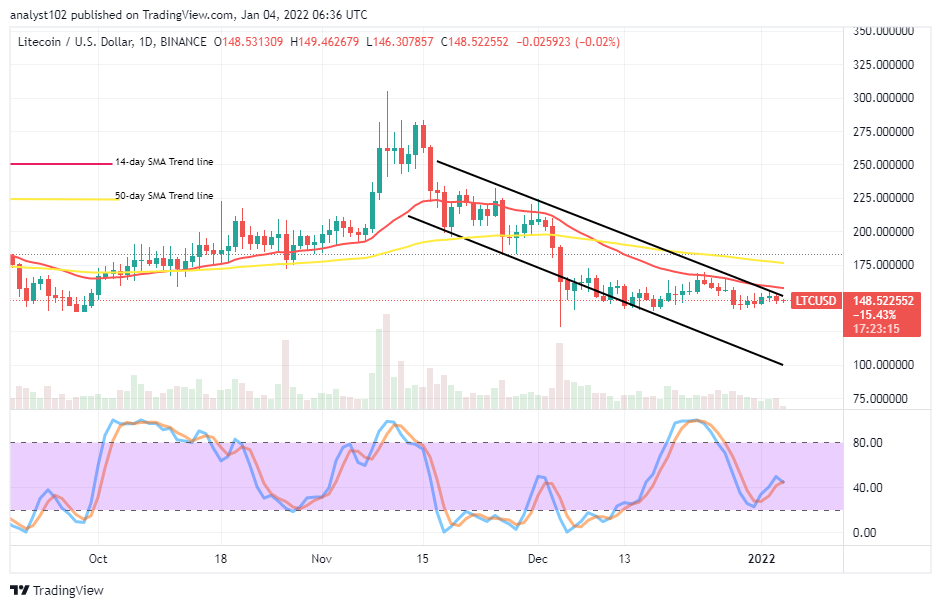
LTC/USD – Daily Chart
It is showcased on the LTC/USD daily chart that the crypto-economic price swings up and down at the $150 trading level. The 14-day SMA indicator is closely positioned above the trading zone of the crypto underneath the 50-day SMA indicator. That signifies that a falling force has been dominating the trade. The Stochastic Oscillators have closed the lines a bit above the range of 40. It could mean that price may still remain under depression for a while.
Will the LTC/USD trade keep moving southward as the crypto-economic price swings up and down at $150?
The LTC/USD trade has been continually moving in a long range at a lower trading level as the crypto-economic price swings up and down at $150. The market operation may not push down to the previous lower-trading zone afterward. The trade level at $125 appears to serve as the critical support baseline the market may push down to achieve a better-off trading stance to make decent strides.
On the downside of the technical analysis, the LTC/USD market short-position takers may have to keep exerting depressions on the market, using the trend line of the 14-day SMA for making order execution when a decent sell signal tends to surface. However, if the variant candlesticks featured degenerate into letting the 50-day SMA trend line gets crossed by the smaller in the long-term rum, that will be a sign of invalidation to getting sell signals.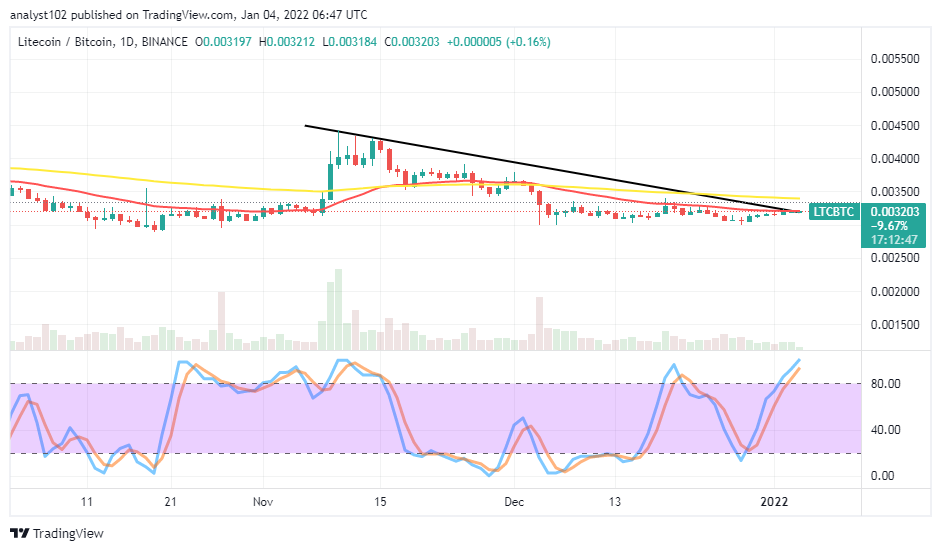
LTC/BTC Price Analysis
In comparison, Litecoin’s swinging energy has seemingly shown, getting exhausted pushing against Bitcoin. The price analysis chart exhibits that the cryptocurrency pair price swings up and down closely beneath the trend line of the smaller SMA. The 50-day SMA indicator is above the 14-day SMA indicator. The Stochastic Oscillators are in the overbought region, slightly pointing to the north. The base crypto appears striving to push against the trending capability of the counter crypto. But, LTC may not hold the position long at a higher zone even if it is northward as placed with BTC.
Note: Cryptosignals.org is not a financial advisor. Do your research before investing your funds in any financial asset or presented product or event. We are not responsible for your investing results.
You can purchase crypto coins here. Buy Tokens