Litecoin (LTC/USD) Seemingly Sets on a Price Recovery Move
Estimated Reading Time: 3 minutes
Don’t invest unless you’re prepared to lose all the money you invest. This is a high-risk investment and you are unlikely to be protected if something goes wrong. Take 2 minutes to learn more
Litecoin Price Prediction – May 18
After a heavy downward correctional movement, the LTC/USD market now appears to have begun a recovery move as price makes a pull-up from a low support level of $260 to currently trade at around $298 level with about a 6.10% increase.
LTC/USD Market
Key Levels:
Resistance levels: $320, $360, $400
Support levels: $260, $240, $220
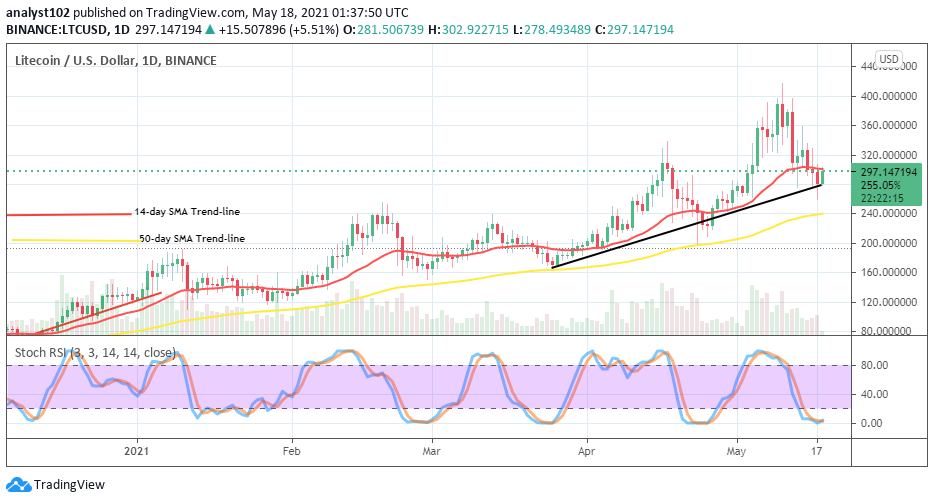
LTC/USD – Daily Chart
The LTC/USD recent market’s downward correctional movement had at last witnessed a southbound break of the smaller SMA during yesterday’s trading operations. But, today, being the subsequent day’s session has been seeing a promising rebounding move up back to the SMA trend-line. The bullish trend-line drew to indicate a support level at $280 below the 14-day SMA trend-line that is located around the $300 point. The 50-day SMA indicator is at the support level of $240. The Stochastic Oscillators are in the oversold region seemingly attempting to open the hairs towards the north for an upswing return in the market.
Will the LTC/USD trade now strongly rebound?
The lower trading zone below the point of $280 has given the crypto market space higher leverage that the LTC/USD bulls need to build up their stance from that support area. In other words, from this technical viewpoint, more upside forces are expected to emerge to break some resistances far over the smaller SMA trend-line in the next operations. However, breaking past the immediate resistance point of both the levels of $320 and $360 will suggest a clearer picture of more futuristic bullish upswings surpassing the previous high value of $400.
On the contrary to the upside market’s sentiment, a price rejection at the level of $320 coupled with an eventual breakdown of a lower point at $300 may potentially lead back to visit support at the $240 level. With that scenario playing out, a further attempt to go lower below that line may cause bears’ a difficult trading situation in no time.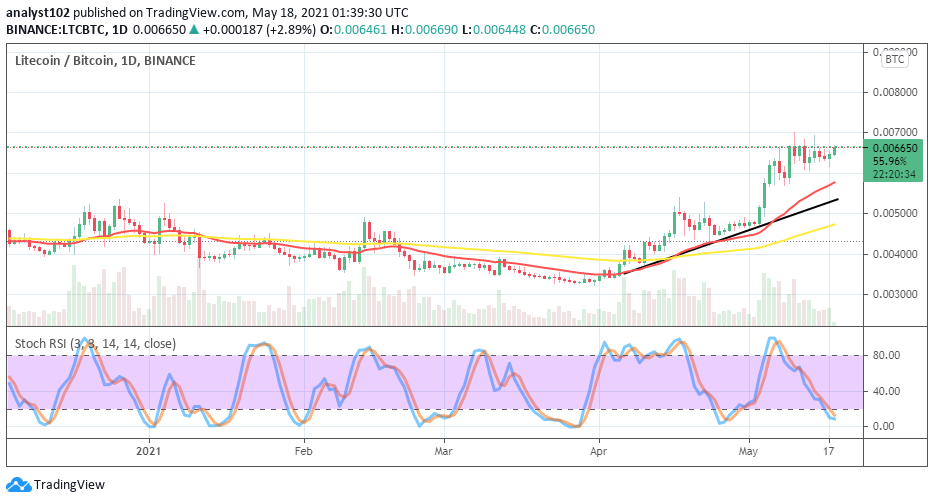
LTC/BTC Price Analysis
The LTC/BTC chart depicts that there is now a line of higher lows indicating that the counter instrument is struggling against the base tool at higher trading zones present in the comparison. The 14-day SMA trend-line and the bullish trend-line are over the 50-day SMA indicator pointing towards the north direction below to indicate more possibility that Litecoin may still visibly push further as paired with Bitcoin. The Stochastic Oscillators have slantingly moved into the oversold region. And, they now seemingly look like attempting to cross back to signal an upswing move in a near time.
Note: cryptosignals.org is not a financial advisor. Do your research before investing your funds in any financial asset or presented product or event. We are not responsible for your investing results.