Litecoin (LTC/USD) Stable Close to $150
Estimated Reading Time: 3 minutes
Don’t invest unless you’re prepared to lose all the money you invest. This is a high-risk investment and you are unlikely to be protected if something goes wrong. Take 2 minutes to learn more
Litecoin Price Prediction – July 13
The market operation of LTC/USD stable close to the line of $150 over a sizeable number of trading sessions. The US Dollar’s worth leads the crypto into trading around the valuation of $132 at a minus percentage rate of about 0.74 as of writing.
LTC/USD Market
Key Levels:
Resistance levels: $150, $200, $250
Support levels: $110, $100, $90
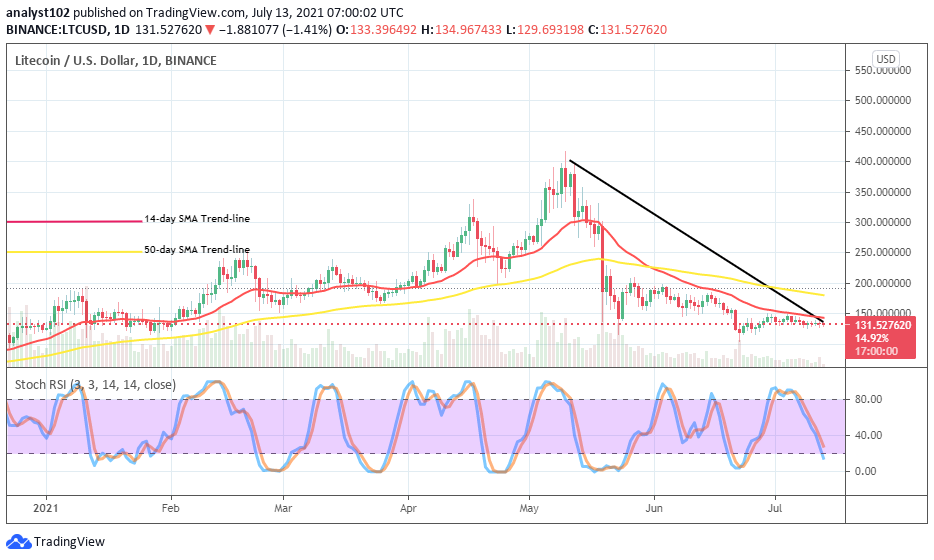
LTC/USD – Daily Chart
The LTC/USD daily trading chart shows that the crypto’s price stable close to the level of $150. The bearish trend-line drew downward to slightly touch past the smaller SMA at the point that has made it to be a crucial zone presently. The 50-day SMA indicator is over the 14-day SMA indicator. The Stochastic Oscillators have slantingly moved southbound to touch the range of 20. That indicates that some degrees of relative forces are ongoing in the crypto economy.
As the LTC/USD market stables close to the $150 level; will there be a continuation until the sessions?
From the technical point of viewing, there seems no much difference coming forth as the LTC/USD market stable close to the level of $150 over some trading sessions. However, underneath the value severally mentioned, bulls are liable to re-find their stances in the market while price pushes downward at getting exhausted. The main support point appears to be around $110 and $100 in the event of a sudden forceful downward force.
On the downside, the downward force appears gradually approaching a level of exhaustion. The Stochastic Oscillators’ downward slant moving posture indicates to testify to that. In the light of that, bears would now have to be wary of their positions beneath the level of $150. Anytime a visible pull-down resurfaces especially, under that point, it will be potentially to allow a buy entry while a reversal is sighted.
LTC/BTC Price Analysis
In comparison, the trending capability between LTC and BTC stable close to the smaller SMA trend-line. The Stochastic Oscillators have crossed the lines between the ranges of 40 and 80. The 50-day SMA indicator is over the 14-day SMA indicator. They both point toward the east direction in confirmation of an ongoing-ranging motion in the crypto market. It somewhat appears that the base crypto is preparing to find support against the flagship counter crypto in the near time.
Note: new.cryptosignals.org is not a financial advisor. Do your research before investing your funds in any financial asset or presented product or event. We are not responsible for your investing results.
You can purchase crypto coins here. Buy Tokens