Uniswap (UNI/USD) Reversal: Trading Re-basing at $10
Estimated Reading Time: 3 minutes
Don’t invest unless you’re prepared to lose all the money you invest. This is a high-risk investment and you are unlikely to be protected if something goes wrong. Take 2 minutes to learn more
Uniswap Price Prediction – April 4
It appears that the re-occurrence process in the price actions that involve Uniswap and the US Dollar will thrive by making rebounds from the area of the lower Bollinger Band, given that the crypto-economic trade is currently reversing, re-basing on $10.
The value line continues to be the most crucial line for obtaining a reasonable entrance into the market, even though the price has reversed steadily and is now averaging the $10 support point. A potential manufacturing mode has arisen in today’s operations. It is also expected to be a successful upward trend that opens doors to more advancements down the road.
UNI/USD Market
Key Levels:
Resistance levels: $14, $15, $16
Support levels: $10, $9, $8
UNI/USD – Daily Chart
The UNI/USD daily chart reveals that the crypto market is reversing, re-basing on the support line of $10.
The Upper Bollinger Band trend line has traversed southerly against the resistance point of $14, creating smaller trade zones to the baseline of $10, making the Lower Bollinger Band the instrumental tool to back it. The stochastic oscillators have had their blue line traversed into the oversold region, denoting that pressure on the decreasing side is gradually losing strength.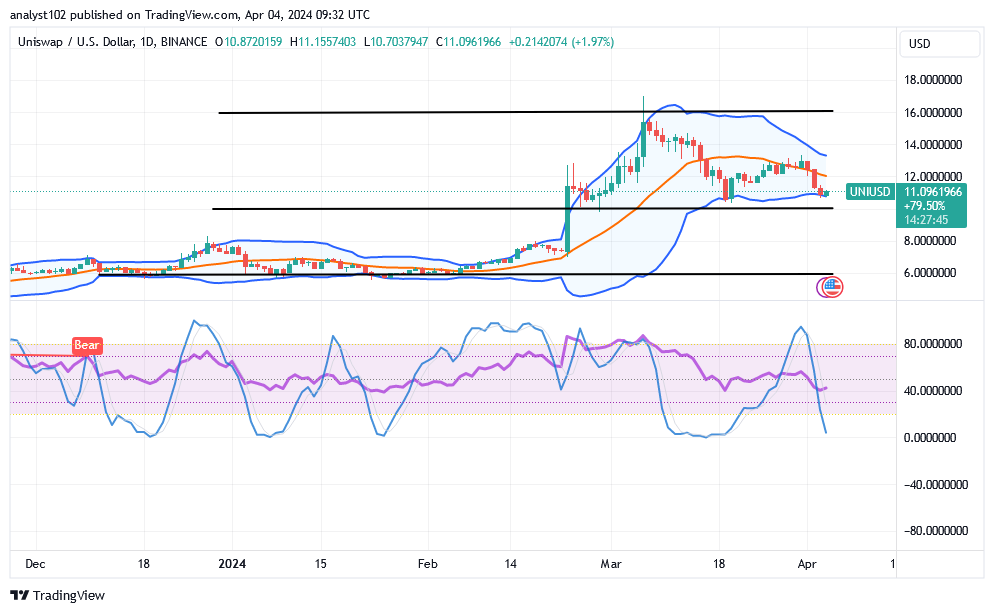
Would it make sense for buyers to enter the market at that moment if the Bollinger Band on the UNI/USD market were to hit lower?
A pull-up has emerged as the UNI/USD trade touches the lower Bollinger Band trend line to give rise to the expectation of getting to see more stable ups in the subsequent operations as the crypto-economic trade is reversing, re-basing its probable rebounding mode on the point of $10.
Technically speaking, long-position pushers will likely be looking for better, decent entry around the $10 value line if the market does permit the observation of a long-holding state against the buy signal of the lower Bollinger Band indicator.
As the situation stands, we do not advise playing in tandem with any price action that breaks the lower Bollinger Band path because this is believed to be a short-term strategy for establishing a movement mode of consolidation that will not last. Because of this, sellers may have to wait for a different set of circumstances to manifest a different pattern, which could result in a bigger positional shortfall of entry orders.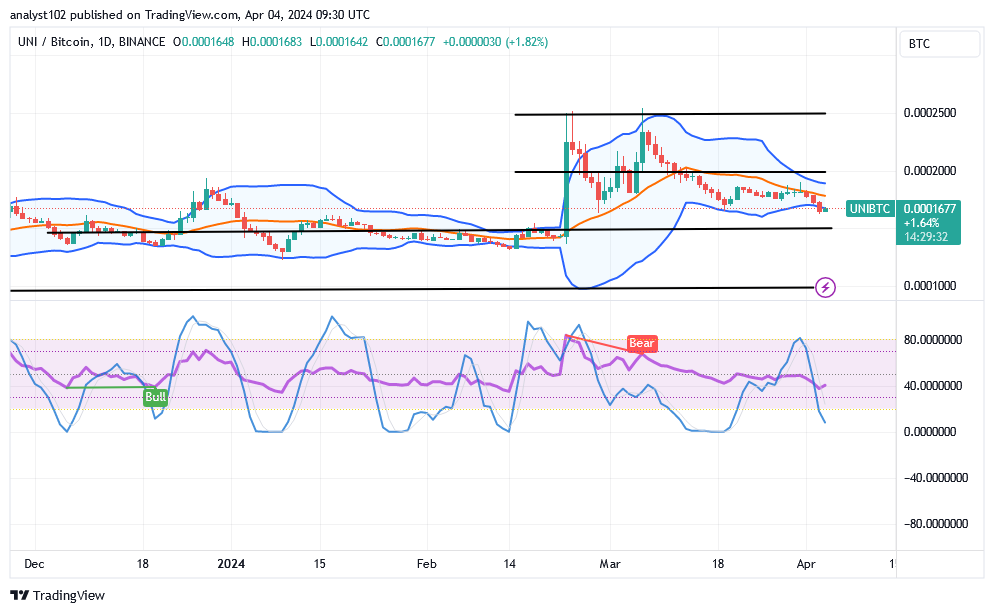
UNI/BTC Price Analysis
In contrast, the Uniswap trade is reversing against the market weight of Bitcoin, based on the lower Bollinger Band trend line.
The trend lines of the Bollinger Band are repositioning at close intervals; a touch to the lower trending part has resulted in a current recovery. With a tendency to rebuild a step, the stochastic oscillators have been entering the oversold area. That suggests that the main cryptocurrency is attempting to revive its positive moves.
\
Note: Cryptosignals.org is not a financial advisor. Do your research before investing your funds in any financial asset or presented product or event. We are not responsible for your investing results.
You can purchase Lucky Block here. Buy LBLOCK