Litecoin (LTC/USD) Trade Depresses, Aiming for a Lower Base
Estimated Reading Time: 3 minutes
Don’t invest unless you’re prepared to lose all the money you invest. This is a high-risk investment and you are unlikely to be protected if something goes wrong. Take 2 minutes to learn more
Litecoin Price Prediction – November 28
As of the time of this analytics write-up, bears are taking charge of the movements in the market activities between Litecoin and the US Dollar as the former instrument trade depresses, aiming for a lower base.
Given that the downward move is in an active mode, the stochastic oscillators’ powerful trade indication is in a pending stance order. But the optimal point of entry has expanded too far, with less chance of ever fully recovering. Given that notion, it is recommended that long-position pushers strengthen their positions in order to stage a recovery around the $65, or the lower Bollinger Band trend line.
LTC/USD Market
Key Levels:
Resistance levels: $75, $80, $85
Support levels:$65, $60, $55
LTC/USD – Daily Chart
The LTC/USD daily chart shows the crypto-economic trade depressing, aiming for a lower base probably toward the underlying support of $65.
The stochastic oscillators have slightly crossed southbound from around the 40 point, indicating that gravity to the downside is ongoing. The Bollinger Band trend lines are in a brief, bent position toward the south. As it is, sellers are in the process of ending the decline sooner than later around the area of the Bollinger Band trend line.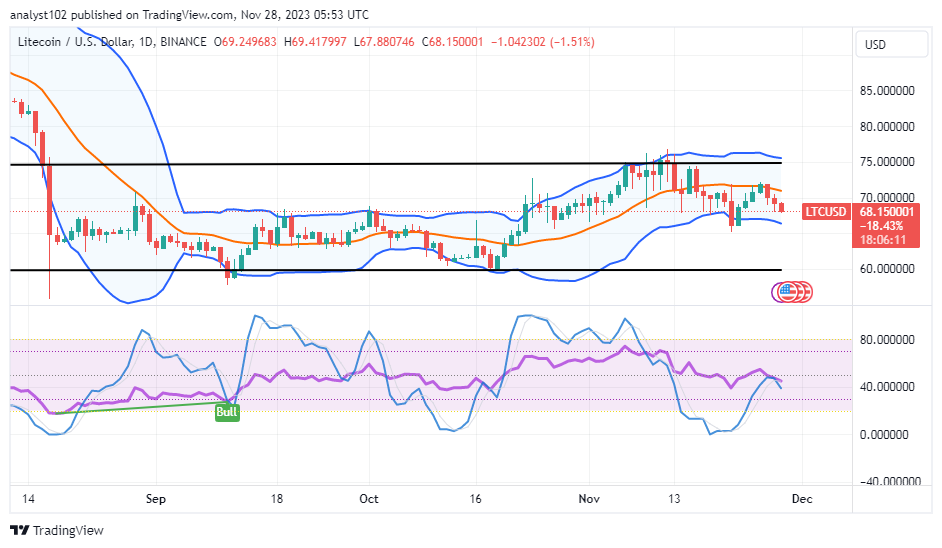
Should bears in the LTC/USD market push apprehensively above $65, will buyers swiftly take up positions against the lower Bollinger Band point?
In the first place, the current negative shifting move should be seen as an opportunity for investors to leverage, as the LTC/USD trade depresses toward the lower Bollinger Band trend line, aiming for a lower base.
The market’s inability to push farther northward past the middle Bollinger Band’s arena signals the beginning of the third day of the current southward movements. At the time of this research, it is anticipated that the motion will reach the lower Bollinger Band before returning to a different directional input pattern that differs from its current prognosis for fall-offs.
Considering that it has been overly anticipated that a positive trading cycle has partially entered, buying chances should soon continue. By doing this, investors can be confident that following a series of declines, there will be exceptional moments of rebounding.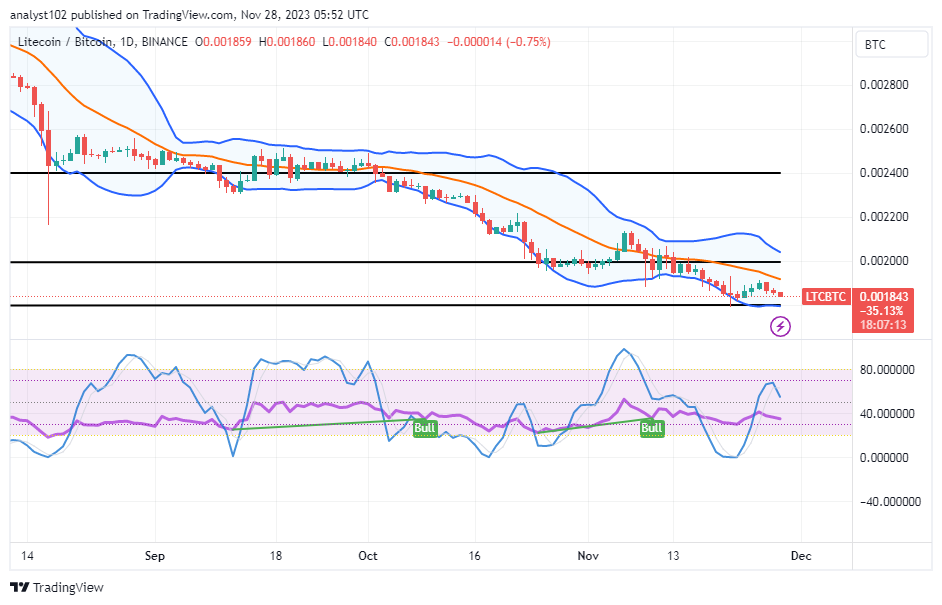
LTC/BTC Price Analysis
In contrast, the Litecoin trade depresses in valuation slowly against the lines of Bitcoin, aiming for a lower base.
The Bollinger Band trend lines are oriented slightly southward, representing the rate of decline in accordance with the middle Bollinger Band trend line’s positional structure. The stochastic oscillators are situated just beneath the 80-line in a southbound crossing pattern. As soon as the candlestick reaches the lower Bollinger Band trend line, an upward-rising phase may resume.
Note: Cryptosignals.org is not a financial advisor. Do your research before investing your funds in any financial asset or presented product or event. We are not responsible for your investing results.
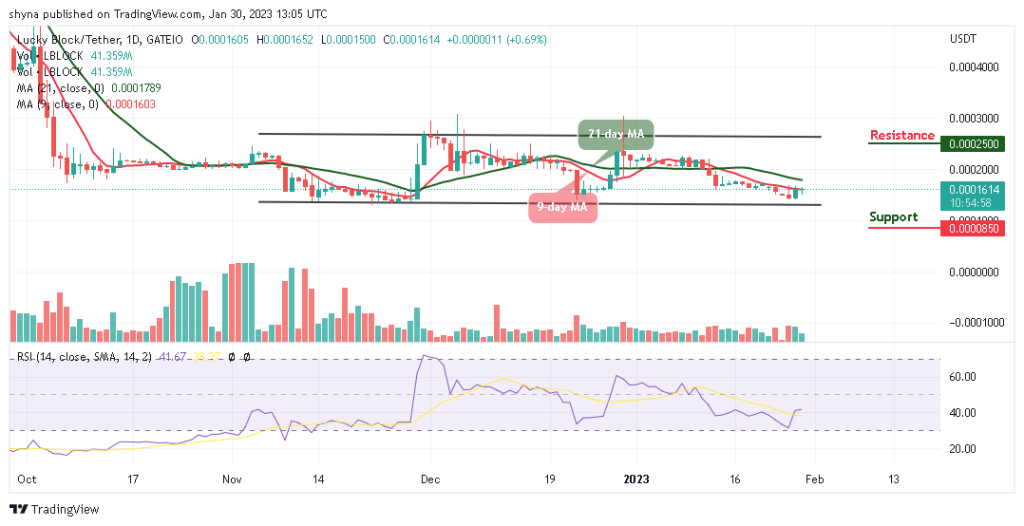
You can purchase Lucky Block here. Buy LBLOCK