Lucky Block (LBLOCK/USD) Market Shows Strong Bullish Intent With Upside Breakout Confirmation
Estimated Reading Time: 3 minutes
Don’t invest unless you’re prepared to lose all the money you invest. This is a high-risk investment and you are unlikely to be protected if something goes wrong. Take 2 minutes to learn more

Lucky Block Price Forecast – June 30
LBLOCK/USD market shows strong bullish intent with upside breakout confirmation. The LBLOCKUSD pair is currently demonstrating a technical rebound from the 0.786 Fibonacci level, marked at approximately $0.00003590, aligning with a confluence of support from the 9-day SMA (Simple Moving Average). This rebound coincides with a declining volume compression followed by a bullish MACD (Moving Average Convergence Divergence) crossover, suggesting a probable trend reversal. The compression of candles around the moving average and the gradual uptick in the MACD histogram further validate renewed bullish momentum in the short term.
LBLOCK/USD Market Key Levels:
Resistance levels: $0.00007460, $0.00009690, $0.00013990
Support levels: $0.00003590, $0.00002000, $0.00000710

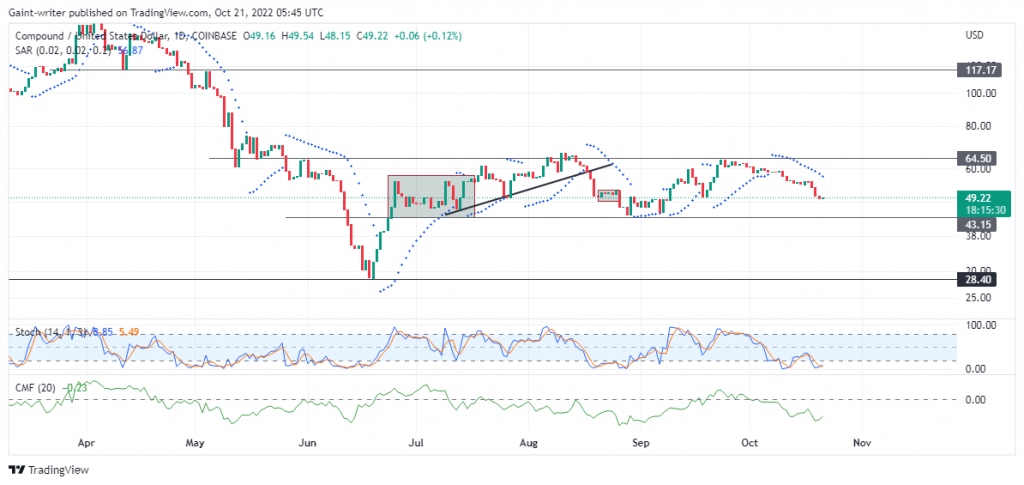
LBLOCK/USD – Daily Chart
The daily chart of LBLOCKUSD shows a breakout to the upside.
Technically, the pair has broken above a descending trendline resistance, signaling the end of the prior correction phase. The clean breakout is reinforced by successive closes above both the 9-day SMA and the previous local support near $0.00003590. Price action is forming a potential bottom structure, supported by higher lows around $0.00003600, with confirmation likely upon a decisive close above the $0.00004000 psychological level.
What is the market outlook of LBLOCK/USD?
Looking ahead, a sustained rally is expected to first test resistance around the $0.00005810 zone (Fibonacci 0.618 level), followed by a likely push towards the key $0.00007460 supply region. Should bullish pressure persist, the ultimate target lies near the previous high at $0.00009690, with long-term extension potential toward $0.00013990.

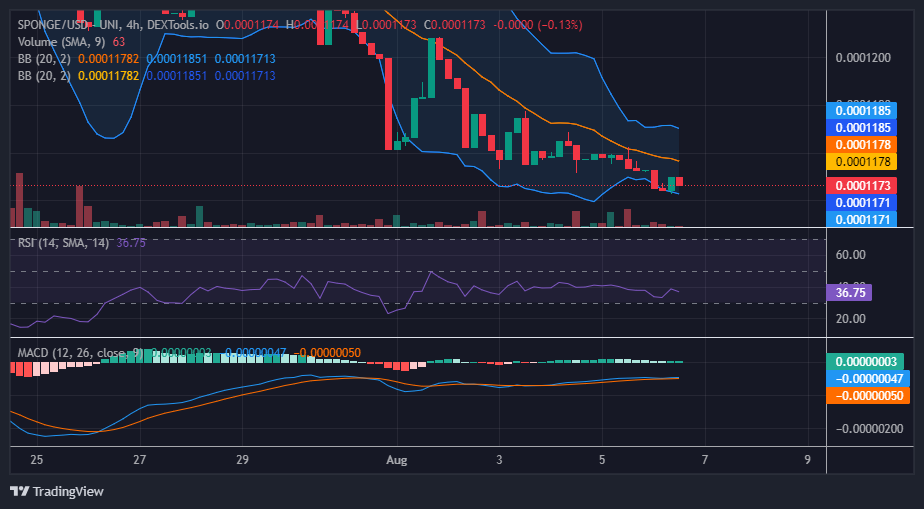
LBLOCK/USD – Four-Hour Chart
LBLOCKUSD has broken above a descending trendline, confirming bullish momentum. Price is consolidating just above the 9-period SMA at $0.00003610, suggesting potential for further upside.
MACD histogram remains in positive territory with signal lines preparing for a bullish crossover. A clean break above $0.00004000 could open the door to $0.00007460 and potentially $0.00009690.
Lucky Block (LBLOCK) Current Statistics
The current price: $0.00003600
Market Capitalization: $2,810,000
Trading Volume: $60,800
Do you need a coin that will 100X soon? Get LBLOCK here