Lucky Block Price Prediction: LBLOCK/USD Could Reach $0.000050 Level
Estimated Reading Time: 3 minutes
Don’t invest unless you’re prepared to lose all the money you invest. This is a high-risk investment and you are unlikely to be protected if something goes wrong. Take 2 minutes to learn more
Lucky Block Price Prediction – January 19
The Lucky Block price prediction keeps moving within the moving averages; the coin is waiting for new buyers to come in before moving higher.
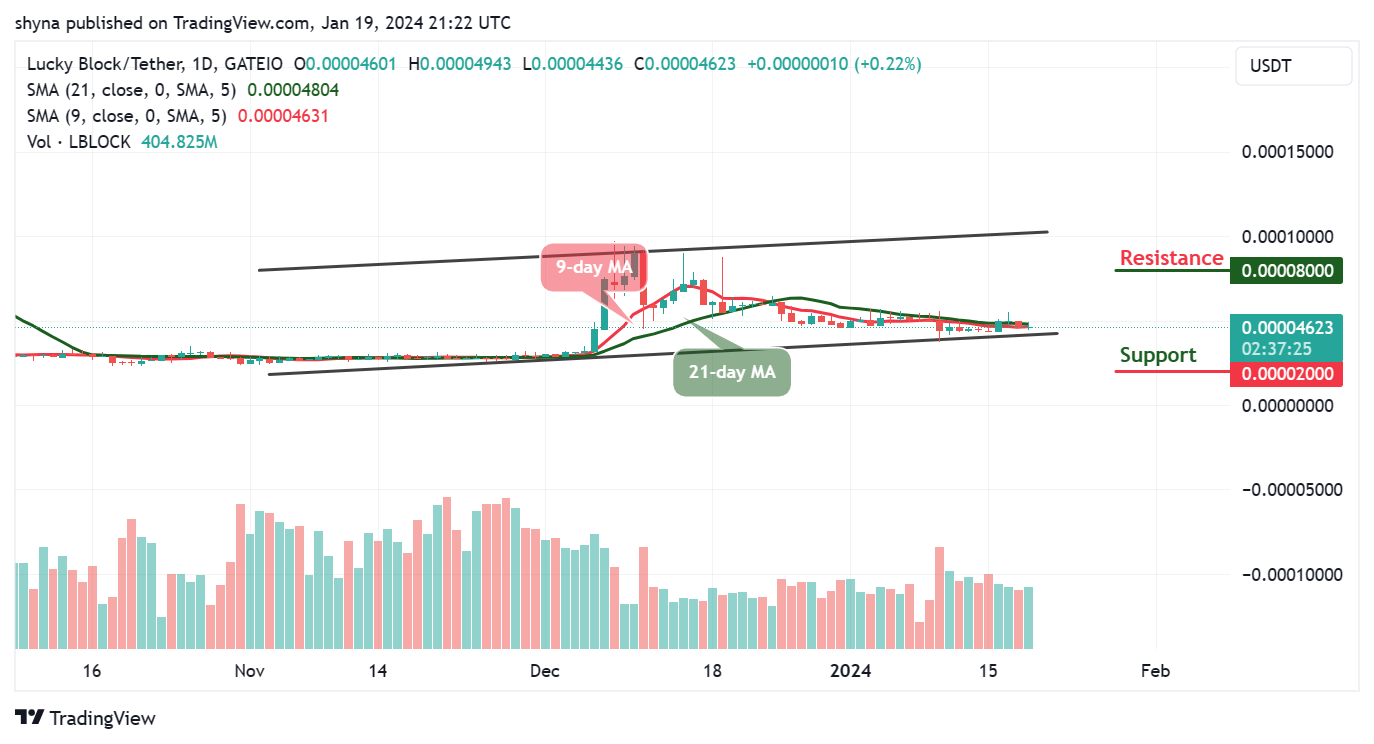
LBLOCK/USD Medium-term Trend: Ranging (1D Chart)
Key Levels:
Resistance levels: $0.000080, $0.000085, $0.000090
Support levels: $0.000020, $0.000015, $0.000010
LBLOCK/USD will begin to follow a bullish movement as the coin moves to cross above the 9-day and 21-day moving averages. The current movement is essential for the coin so that it can reach the resistance level of $000050 as new buyers are expected to enter the market. Meanwhile, if the coin slides below the lower boundary of the channel, the support level of $0.000040 could be reached.
Lucky Block Price Prediction: LBLOCK Continues to Range
The Lucky Block price is hovering within the 9-day and 21-day moving averages. If the coin retreats and faces the south, it will be a good opportunity for the existing buyers to buy the dip while the new buyers could invest in the coin. However, if the bears step into the market, any bearish movement may locate the supports at $0.000020, $0.000015, and $0.000010.
Meanwhile, if the buyers hold the current market value and push it to the upside, the bulls can move near the upper boundary of the channel, and any further bullish movement could hit the resistance levels at $0.000080, $0.000085, and $0.000090 respectively.
LBLOCK/USD Medium-term Trend: Ranging (4H Chart)
On the 4-hour chart, the Lucky Block (LBLOCK) trades bullishly as the buyers are preparing to come into the market by crossing above the 9-day and 21-day moving averages. LBLOCK/USD is trading near the resistance level of $0.000050.
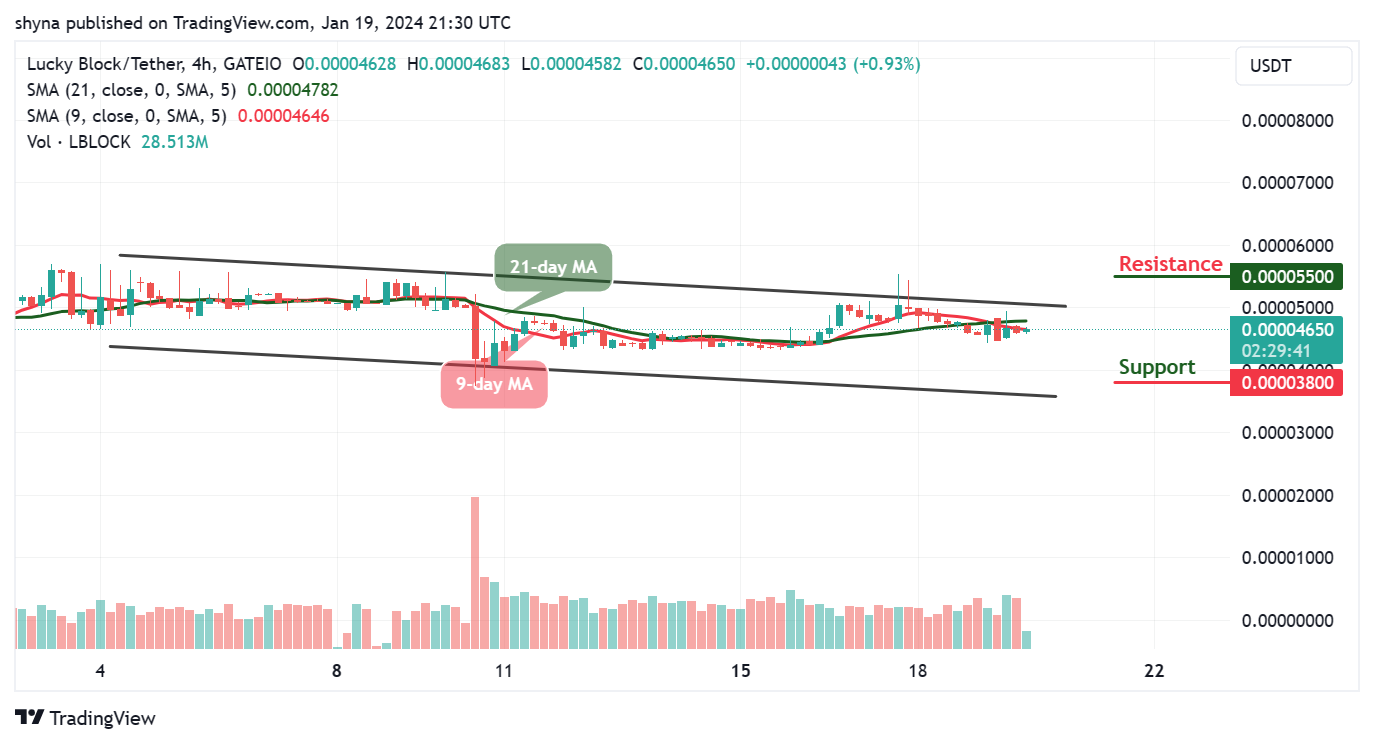
Nonetheless, the buyers are holding the coin below the moving averages, if the bulls increase the buying pressure and push the coin above the upper boundary of the channel, higher resistance could be located at $0.000055 and above, but any bearish movement could hit the support at $0.000038 and below.
You can purchase Lucky Block here. Buy LBLOCK