Lucky Block Price Prediction: LBLOCK/USD Prepares for a Breakout Above $0.0040
Estimated Reading Time: 3 minutes
Don’t invest unless you’re prepared to lose all the money you invest. This is a high-risk investment and you are unlikely to be protected if something goes wrong. Take 2 minutes to learn more

Free Crypto Signals Channel
The Lucky Block price prediction may begin to form higher as the coin gets ready for a spike above the moving averages.
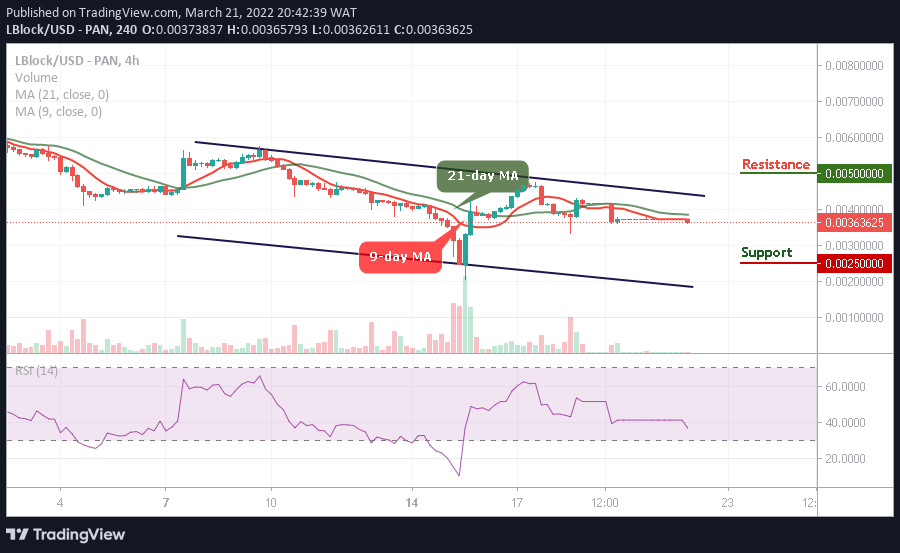
LBLOCK/USD Medium-term Trend: Ranging (4H Chart)
Key Levels:
Resistance levels: $0.0050, $0.0055, $0.0060
Support levels: $0.0025, $0.0020, $0.0015
At the time of writing, LBLOCK/USD is ranging as the market price prepares to cross above the 9-day and 21-day moving averages. Meanwhile, the coin is moving around the $0.0036 level as the in-coming bullish pressure may break up the $0.0040 level. However, should the bulls fail to push the price upward, the Lucky block price may consolidate for the new buyers to come into the market.
Lucky Block Price Prediction: LBLOCK/USD May Consolidate before Breaking Higher
After retreating below the support level of $0.0040, the Lucky Block price would rise and break above the 9-day and 21-day moving averages. However, any bullish movement towards the upper boundary of the channel may push the price to the potential resistance levels of $0.0050, $0.0055, and $0.0060.
On the contrary, if the bears break towards the lower boundary of the channel, the Lucky Block price could hit the support levels of $0.0025, $0.0020, and $0.0015. Meanwhile, the technical indicator Relative Strength Index (14) is moving under 40-level to prepare the coin for the bullish movement.
LBLOCK/USD Medium-term Trend: Ranging (2H Chart)
According to the 2-hour chart, the Lucky Block price is ranging below the 9-day and 21-day moving averages as the bulls are seen gathering momentum in other to push the coin towards the upper boundary of the channel. Therefore, the new investors are expected to take the advantage of this by coming into the market or reinvesting.
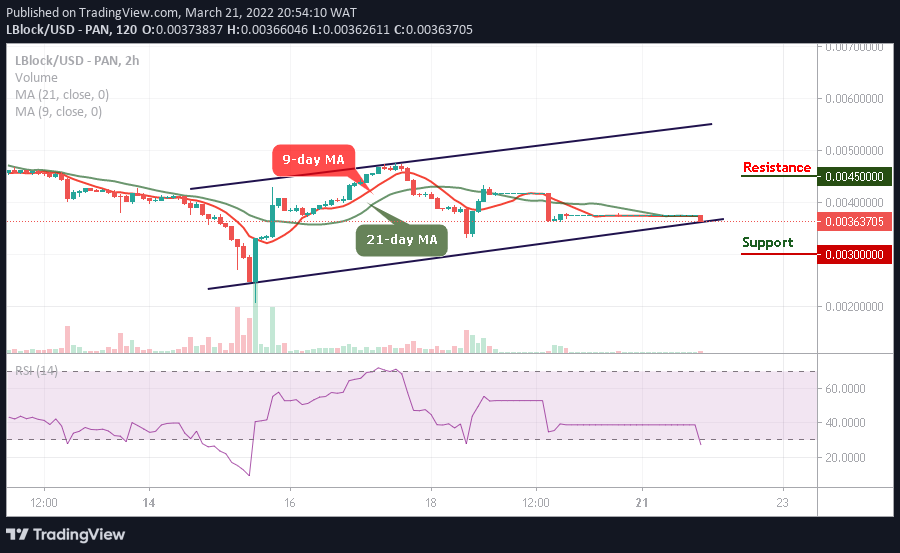
However, if the buyers push the price and move towards the upper boundary of the channel, higher resistance could be reached at $0.0045 and above, while the technical indicator Relative Strength Index (14) moves into the oversold region. On the contrary, if the bulls fail to move the current market value above, the bears may bring the market to the support level of $0.0030 and below.
Read more: